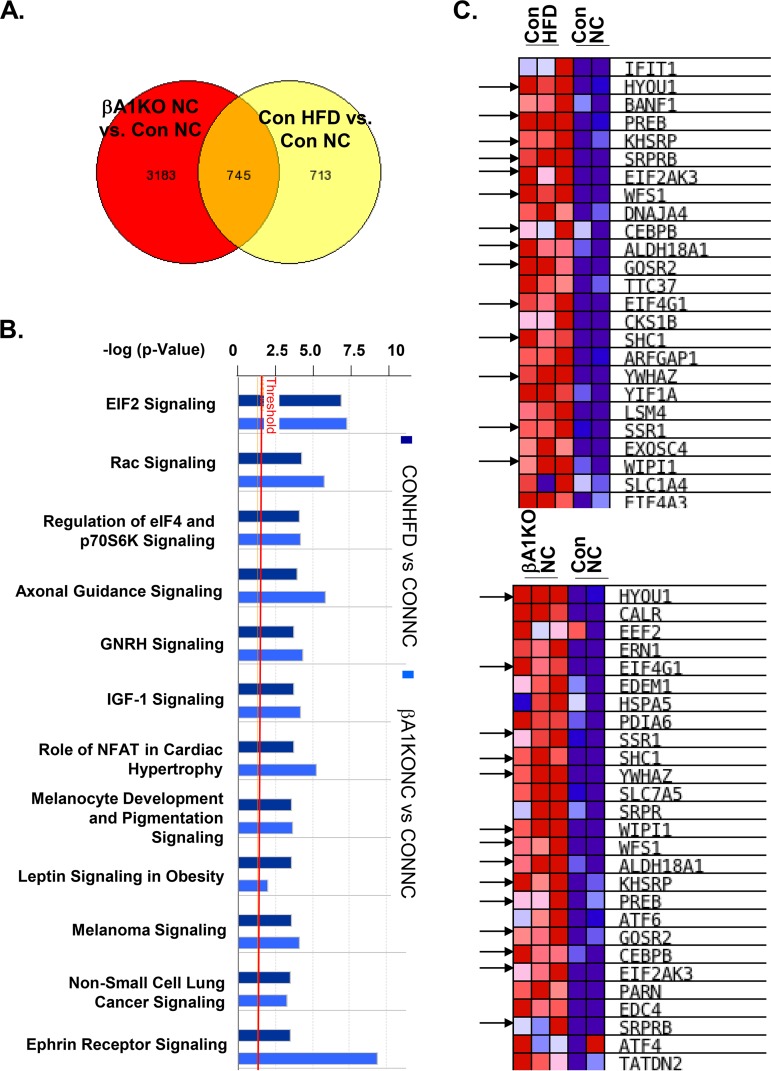
FIG 4.
AKT1 deficiency in β cells induces eIF2 and ER stress signals. (A) Venn diagram demonstrating genes mutually changed by HFD versus NC and by Akt1 deletion versus controls. Genes that increased or decreased more than 2-fold between the indicated groups were included in the analysis. RNA-seq data obtained with islets (n = 3) isolated from different groups of mice were analyzed. Con NC, control mice fed normal chow; Con HFD, HFD-fed control mice; βA1KO NC, mice with Akt1 deletion in β cells fed on NC; βA1KO HFD, mice with Akt1 deficiency in β cells fed on HFD. (B) Ingenuity Pathway Analysis (IPA) identified eIF2 signaling to be the most upregulated signal after HFD feeding in control mice or due to AKT1 deficiency in β cells. (C) Gene set enrichment analysis (GSEA) shows ER stress marker genes in the indicated groups of mice. Arrows indicate genes that were upregulated in both control mice and AKT1 deficiency groups.

