Fig. 4.

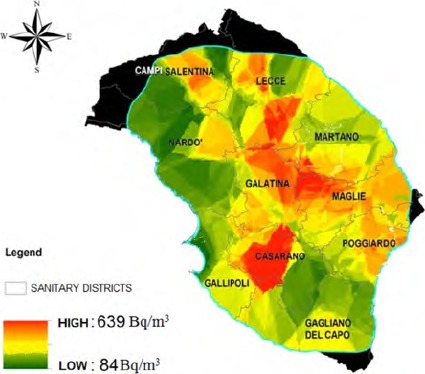
Map of Radon Concentrations for Local Health Districts: in the red and orange areas radon concentrations exceed 400 Bq/m³.

Map of Radon Concentrations for Local Health Districts: in the red and orange areas radon concentrations exceed 400 Bq/m³.