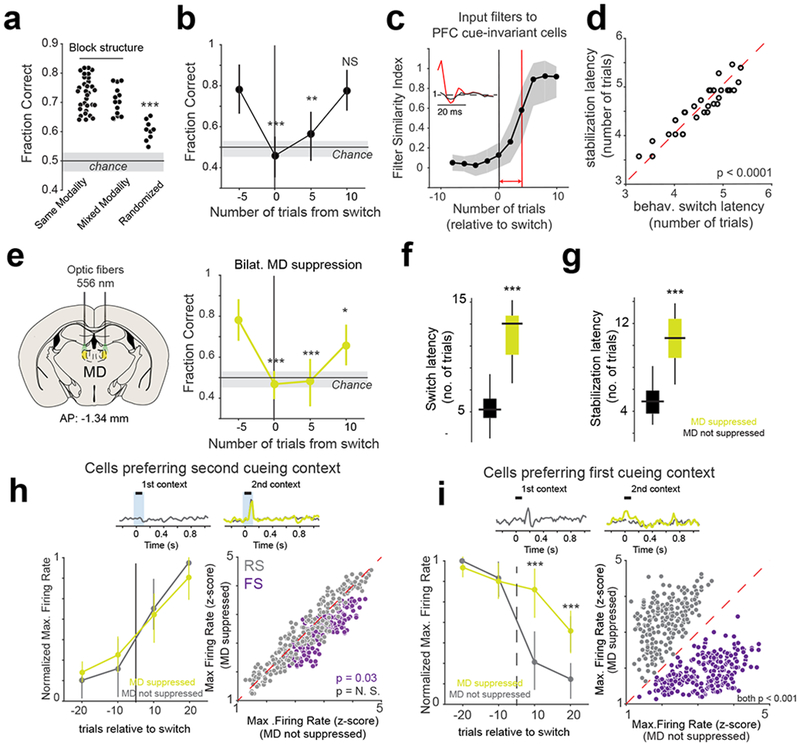
Fig. 3.

Flexible switching between contexts is associated with MD-dependent changes in PFC activity
(a) Comparison of fraction correct trials between the different task conditions. Each data point is one session per mouse from 3 mice in total. *** p = 0.023 x 10⁻³, Bonferroni-corrected Kruskal-Wallis ANOVA. Note, each session is treated as an independent sample. (b) Change in behavioral performance (fraction correct) relative to switch. **p < 0.01, *** p < 0.001. One-way Rank-sum test relative to 5 trials before the switch. n = 33 independent sessions from 3 mice. Data is shown as mean +/− SEM. (c) Change in filter similarity index of coupling filters from cue-selective to cue-invariant neurons in the PFC relative to switch. Insets show an example coupling filter changing between the point of switch (black) to its final stable value (red). Red line marks the filter stabilization latency. Shaded area, 95% CI. For details, see Methods. (d) Scatter plot relating behavioral (behav.) switch latency with the filter stabilization latency for inputs to cue-invariant PFC neurons. Each data point is a session (p = 0.0068 x 10⁻⁶, two-way rank-sum test, n = 33 independent sessions from 3 mice). (e) Left: Schematic illustrating bilateral MD suppression. Right: Change in behavioral performance (fraction correct) relative to switch for sessions with bilateral MD suppression. Statistics and plotting same as (b). (f-g) Box-plots comparing the effect that MD suppression has on behavioral switching latency (f, *** p = 0.78 x 10⁻⁴, Kruskal-Wallis ANOVA) and cue-invariant input filter stabilization latency (g, *** p = 0.19 x 10⁻⁴, Kruskal-Wallis ANOVA). N = 33 sessions with no suppression, 31 sessions with MD suppression from 3 mice. (h) Top: Example PSTH of a PFC neuron selective to cues in the second cueing context. Left: Time course of the change in normalized maximum firing rate (relative to stable behavior) relative to the switch. No significant difference (p = 0.92 between suppressed and non-suppressed conditions). Right: Scatter plot comparing the maximum firing rate of PFC cue selective neurons (grey) and PFC FS neurons (purple) 10 trials after switch. (i) As in (h) but showing the effect that MD suppression has on PFC cells that are selective for cues in the first cueing context. Left: *** p < 0.001, one-way rank-sum test for each time point between suppressed and non-suppressed conditions, n = 3 mice. Data is shown as mean +/− SEM. Right, p < 0.001 one-way rank-sum test for each time point between suppressed and non-suppressed conditions, n = 3 mice.
