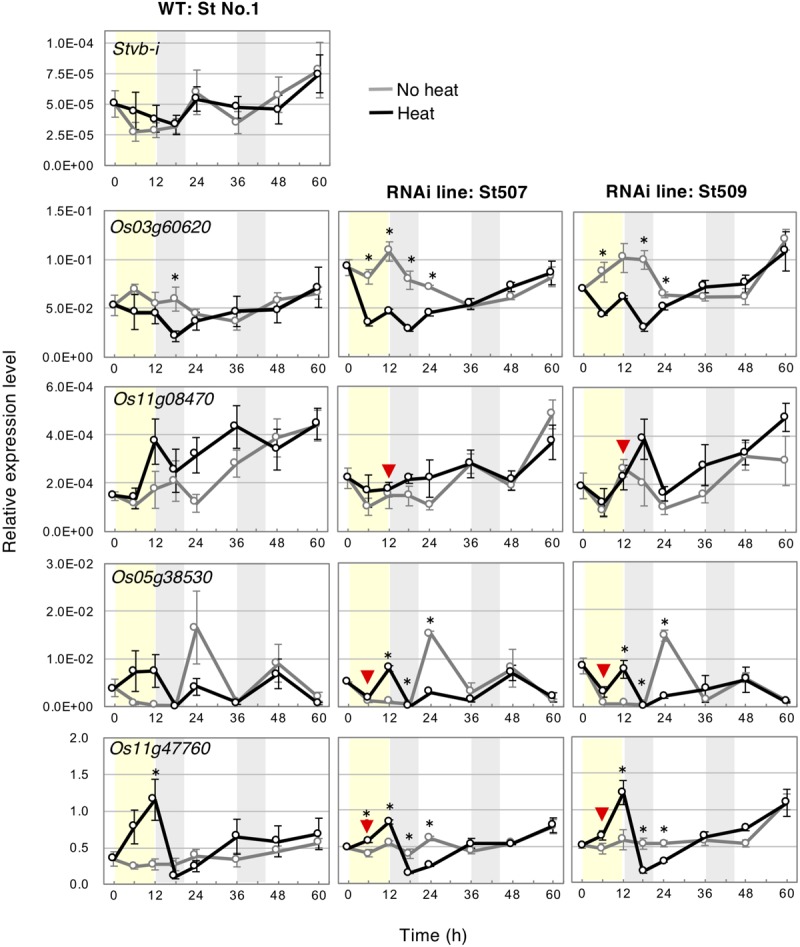
FIGURE 7.

Effect of heat treatment on the expression of Stvb-i and Hsp genes in seedlings of WT St No. 1 and Stvb-i–silenced lines at 1.5-leaf stage. Relative expression levels were calculated from quantitative RT-PCR results using OsGAPDH as a reference and are shown as means ± SEM (n = 3). Red arrowheads indicate the unaffected gene expression in RNAi lines in comparison with WT in heat-treated plants. Asterisks show significant differences between heated and non-heated samples (Tukey–Kramer test, p < 0.05, n = 3). Light yellow shading represents 12-h heat treatment at 38°C. Light gray shading represents the 8-h dark period.
