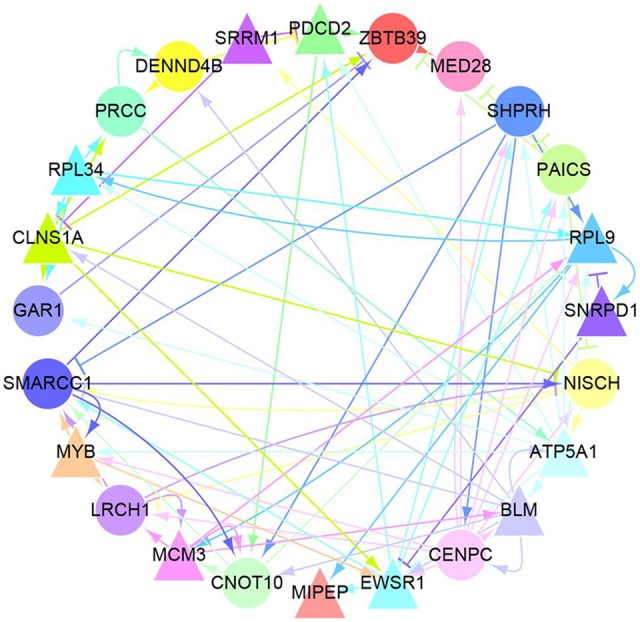
Figure 3.

Gene regulatory network among 24 “Hub” genes. The color of a gene (circle or triangle nodes) matches the color of its arrows to identify regulatory relationships between these genes more efficiently. There are two types of arrows: sharp arrows indicate the promotion of expression and blunt arrows mean the inhibition of expression. In addition, there are 12 genes (triangular nodes) whose CNV have a significant promoting effect on their respective expression process. They are SRRM1, PDCD2, RPL9, SNRPD1, ATP5A1, BLM, EWSRI, MIPEP, MCM3, MYB, CLNSIA and RPL34. it is worth noting that genes regulated by these 24 genes but not the “Hub” are not included in Figure 3.
