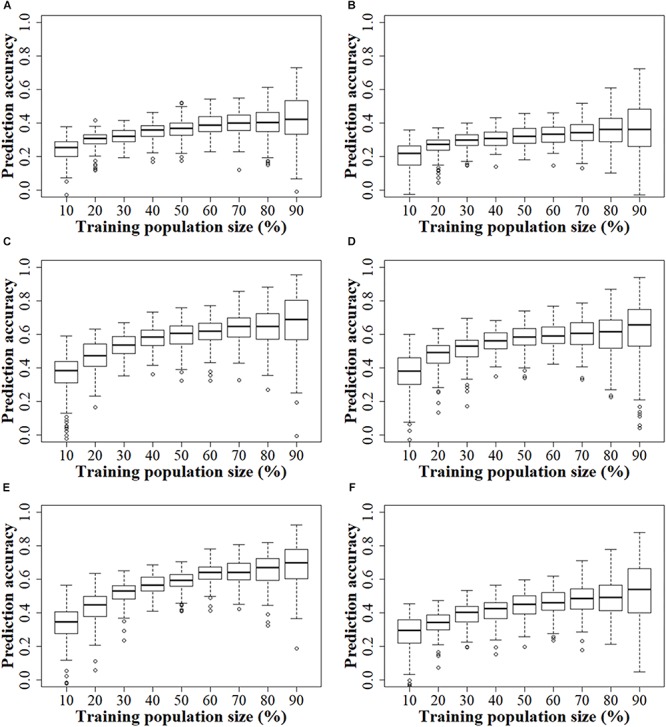
FIGURE 4.

Genomic prediction accuracies of kernel Zn concentration in the DTMA panel, DH1 population, and DH2 population, when the training population size was set from 10 to 90% of total genotypes, with an interval of 10%. Panel (A) in the DTMA panel estimated with GBS markers; (B) in the DTMA panel estimated with rAmpSeq markers; (C) in the DH1 population estimated with GBS markers; (D) in the DH1 population estimated with rAmpSeq markers; (E) in the DH2 population estimated with GBS markers; (F) in the DH2 population estimated with rAmpSeq markers.
