
FIGURE 6.
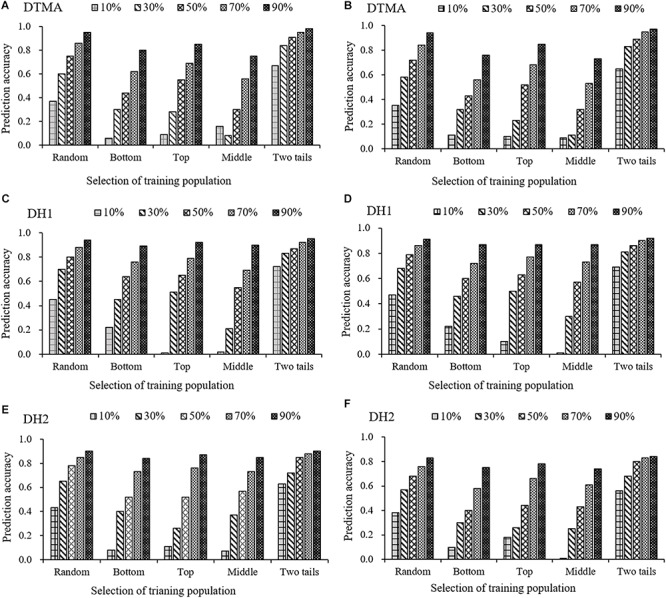
Genomic prediction accuracies of kernel Zn concentration in the DTMA panel, DH1 population, and DH2 population, when the training population was formed by sampling the same percentage of genotypes with random selection (Random), with selection from the bottom tail (Bottom), with selection from the top tail (Top), with selection from the middle part (Middle), and with selection from the two tails (Two tails). The training population ranged from 10 to 90% of the total genotypes, with an interval of 20%. Panel (A) in the DTMA panel estimated with GBS markers; (B) in the DTMA panel estimated with rAmpSeq markers; (C) in the DH1 population estimated with GBS markers; (D) in the DH1 population estimated with rAmpSeq markers; (E) in the DH2 population estimated with GBS markers; (F) in the DH2 population estimated with rAmpSeq markers.