
Figure 4.
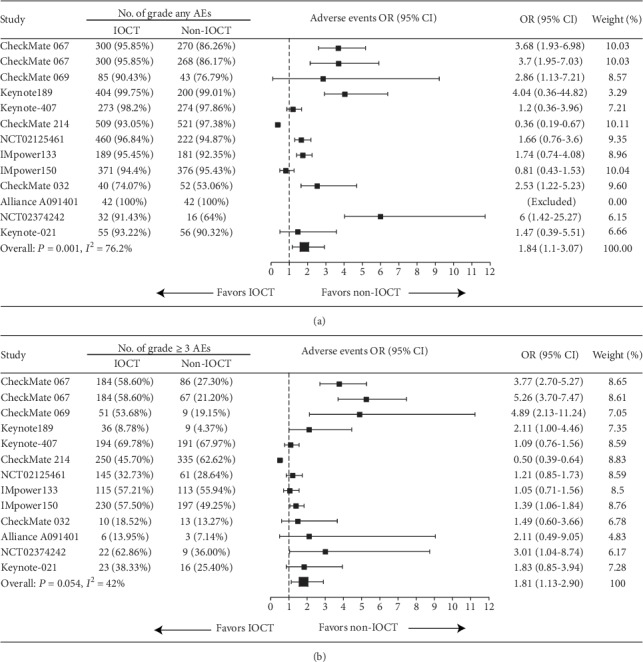
Forest plot of ORs comparing high-grade treatment-related AEs in patients who received IOCT vs. non-IOCT. Studies are listed on the left with respective number of patients of each treatment, OR with 95% CI and weight are on the right. (a) AEs regardless of the grade; (b) grade ≥ 3 AEs. OR: odds risk; IOCT: immuno-oncology combination treatment, CI: confidence interval; AE: adverse event.