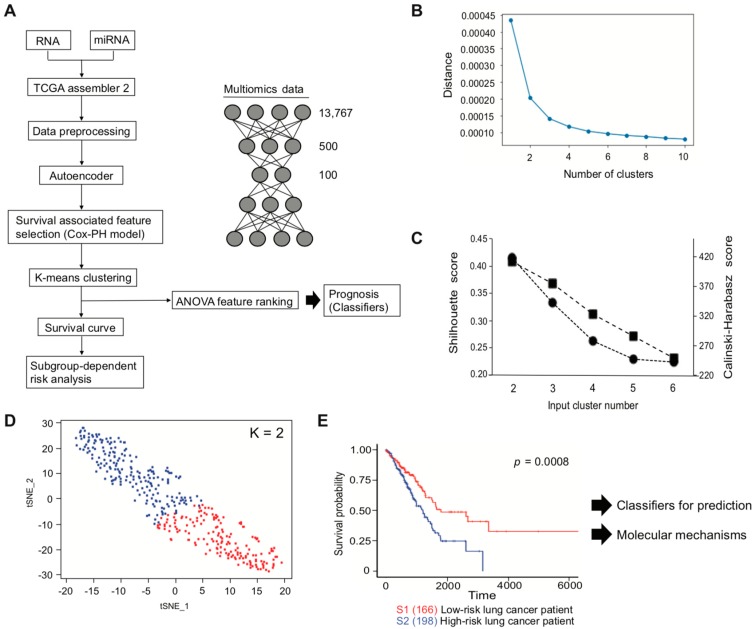
Figure 1.
Overall workflow for classification of lung-cancer subtypes. (A) Multi-omics analysis pipeline. (B) Clustering result of elbow method. (C) Clustering results of the Silhouette index and Calinski–Harabasz criterion. (D) Clustering result of K-means clustering. Red dot represents S1, and blue dot represents S2 subtype in Figure 1E. (E) Kaplan–Meier plot using patient labels obtained from Figure 1D.

