Figure 3.
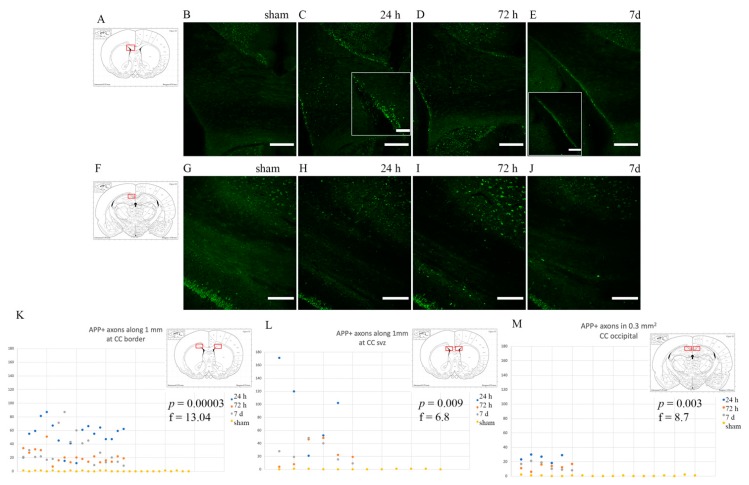
APP expression in the corpus callosum. Fluorescence microscopy photographs of the corpus callosum (coronal sections) at around 1mm from bregma (top row) and around −3 mm from bregma (bottom row). (A,F) The highlighted area refers to the area represented in the photographs on the same row. (C–E) Following injury, axonal bulbs localize mostly at the borders between the corpus callosum and grey matter. Insert show details of the CC-lateral ventricle border area. (H–J,M) Moving occipitally, APP expression is comparatively less. (B,G) Sham animals do not show APP accumulation in the axonal terminals at the regions of interest. (K–M) Scatter plots showing the amount of APP+ profiles in each ROI (y-axis represents the number of APP+ profiles; x-axis represents each observation). APP expression is maximal at 24 h and decreases thereafter, with p ≤ 0.05 at one-way ANOVA analysis. Scale bar = 300 µm (top row); scale bar = 500 µm (bottom row); scale bar = 150 µm (C insert); scale bar = 500 µm (E insert).

