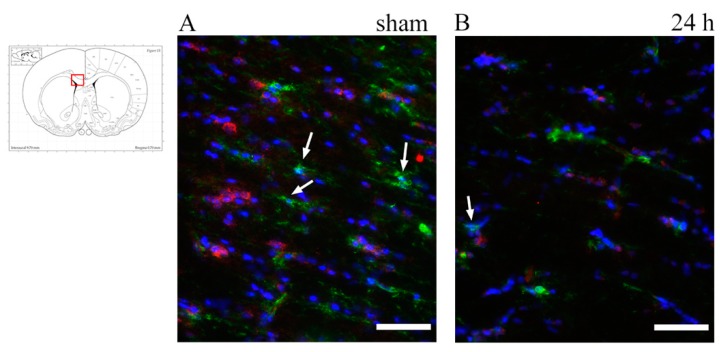
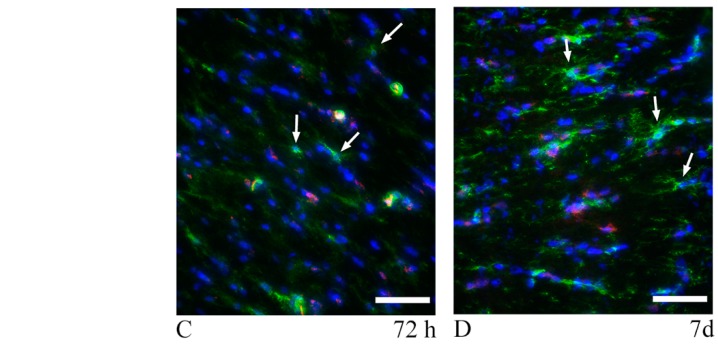
Figure 7.
NG2 expression in the corpus callosum at around 1 mm from bregma. (A–D) Fluorescence microscopy photographs show NG2+ oligodendrocyte progenitor cells in the corpus callosum. Double staining with Occludin (red) was done to distinguish NG2+ (green) vessel walls from oligodendrocyte progenitor cells (OPCs). DAPI+ nuclei are stained in blue. Arrows show NG2+/DAPI+/Occludin− OPCs, which appear scattered throughout the corpus callosum, with no apparent difference between sham and trauma-exposed subjects. Insert: the highlighted area refers to the area represented in (A–D). Scale bar = 50 µm.


