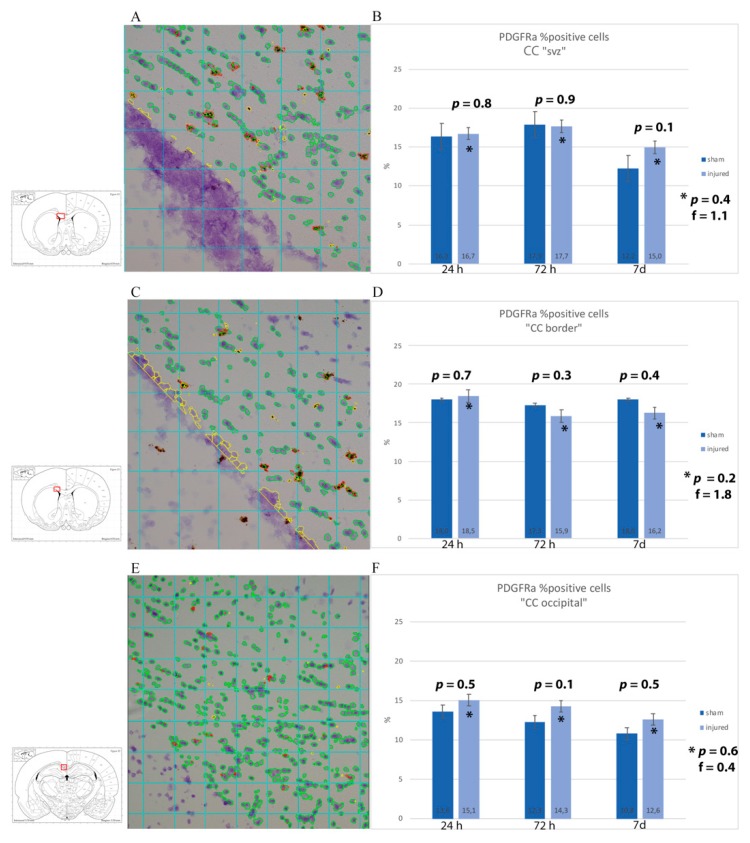
Figure 9.
RNAscope analysis with PDGFRa mRNA probe of corpus callosum. (A,C,E) Sample of RNAscope light microscopy picture of injured subjects set for analysis with Fiji ImageJ. The insert shows the region of interest squared in red, namely (A) CC just dorsal of the subventricular zone (CC “SVZ”), (C) area of the corpus callosum at around 1 mm from Bregma at the border with the caudoputamen, and (E) corpus callosum at around −3 mm from Bregma. All the cells considered for the analysis are circled in green, while in red are the PDGFRa probe clusters. In yellow is what has been manually excluded because it was considered as background/not part of the region of interest. (B,D,F) Results from the image analysis are presented as averages of the percentages of the number of cells expressing PDGFRa mRNA out of the total number of cells from each subject in the ROI. While a trend of an increased number of PDGFRa-expressing cells was observed in injured as compared to sham when analyzing the whole width of the corpus callosum at around 1 and −3 mm from bregma, this is not true when considering a smaller ROI of the corpus callosum at around 1 mm from bregma. Moreover, such differences were at no timepoint statistically significant. * p indicates results from one-way ANOVA analysis, while p is from Student t-test.

