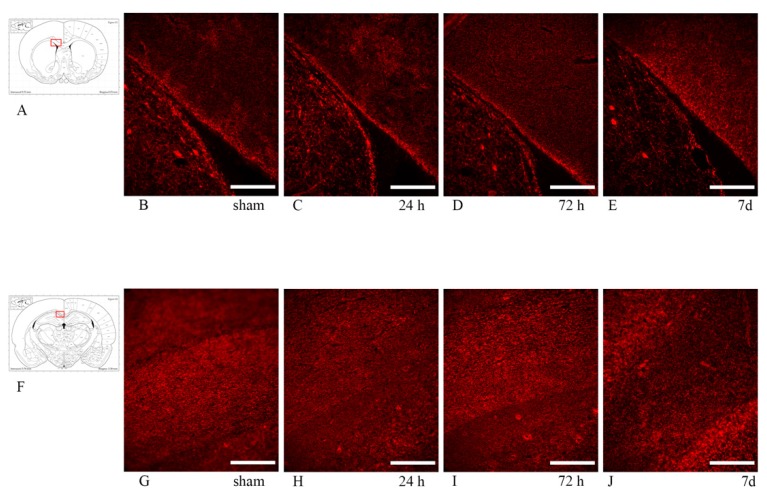
Figure 10.
Rip (top row) and MBP (bottom row) expression in the corpus callosum. Fluorescence microscopy photographs of the corpus callosum (coronal sections) in different regions of interest. MBP and Rip stainings identify the myelin sheath. (A,F) The highlighted area refers to the area represented in each row. (B–E) anti-Rip antibody expression in the corpus callosum at around 1 mm from bregma, adjacent to the lateral ventricle. Rip expression appears similar between sham and exposed animals at all timepoints. (G–J) anti-MBP antibody expression in the corpus callosum at around −3 mm from bregma. No clear difference is noted between sham and exposed animals at all timepoints. Scale bar = 200 µm.

