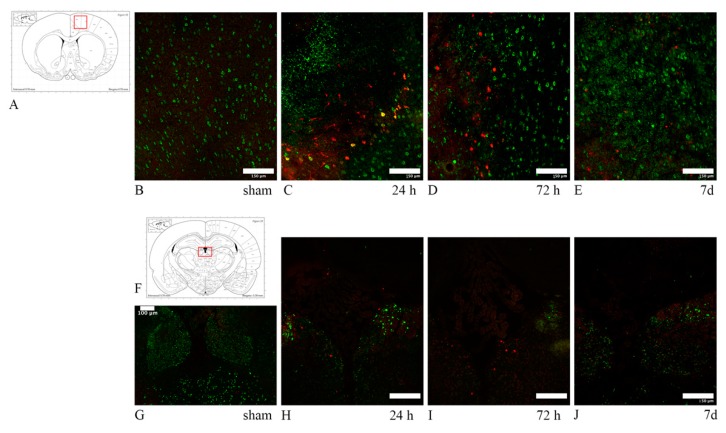
Figure 12.
HSP70/ATF3/APP expression reflecting neuronal stress. (A,F) The highlighted area refers to the area represented in each row. (B–E) HSP70 (red) and APP (green) double staining in the dorsal cortex. While APP expression remains elevated through 7 d, HSP70 expression is comparatively decreased at 7 d. Few neurons are HSP70+/APP+. (G–J) ATF3 (red) and APP (green) double staining in the habenular nuclei. ATF3 follows the same expression pattern as HSP70, with decreased marker uptake at 7 d. In all cases, sham animals do not express any of the tested markers, with only the baseline marker uptake visible. Scale bar = 150 µm (Scale bar = 100 µm in image (F)).

