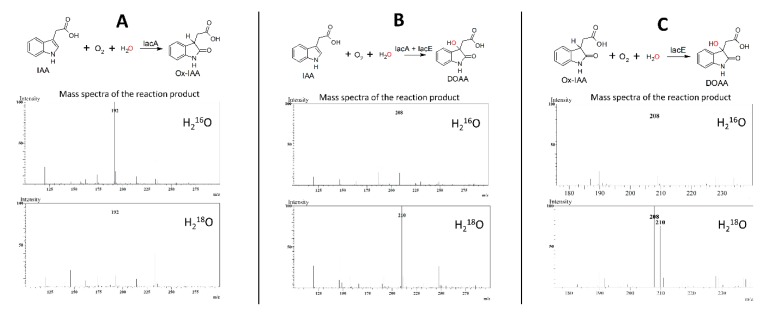
Figure 6.
Mass spectra of Ox-IAA and DOAA obtained by using E. coli cells expressing IacA and IacE in H216O environment and H218O environment. (A)—Ox-IAA from IAA + IacA, (B)—DOAA from IAA + IacAE, (C)—DOAA from Ox-IAA + IacE. All mass spectra that are presented were recorded in positive ionization mode.

