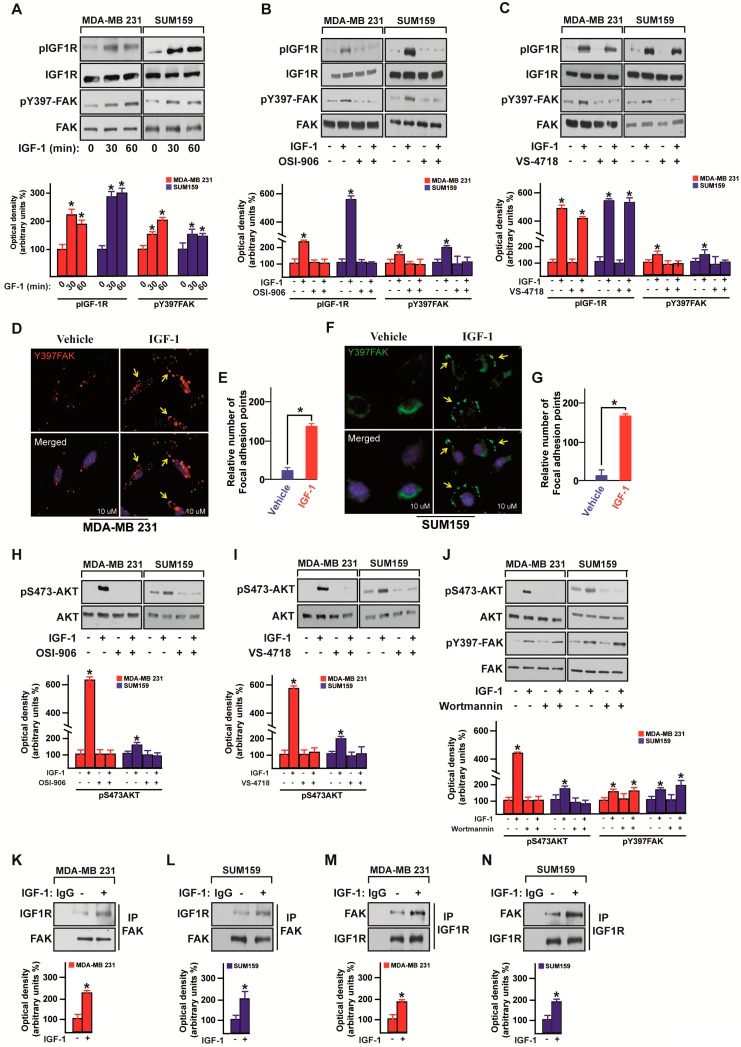
Figure 3.
IGF-1 triggers Focal Adhesion Kinase (FAK) activation. (A) Immunoblots showing the phosphorylation of both IGF-1R and FAK in MDA-MB 231 and SUM159 TNBC cells upon IGF-1 stimulation (50 ng/mL), as indicated. (B) Immunoblots showing the phosphorylation of both IGF-1R and FAK in MDA-MB 231 and SUM159 TNBC cells treated for 30 min with IGF-1 (50 ng/mL) alone or in combination with the IGF-1R inhibitor OSI-906 (1 µM). Underlying panels show densitometric analysis of the immunoblots normalized to the loading controls. (C) Immunoblots showing the phosphorylation of both IGF-1R and FAK in MDA-MB 231 and SUM159 TNBC cells treated for 30 min with IGF-1 (50 ng/mL) alone or in combination with the FAK inhibitor VS-4718 (100 nM). Underlying panels show densitometric analysis of the immunoblots normalized to the loading controls. (D) Fluorescence images of MDA-MB 231 cells exposed for 30 min to IGF-1 (50 ng/mL). Anti-pY397 FAK staining was detected in red and nuclei were stained with DAPI. Yellow arrows indicate focal adhesions. Scale bars, 10 µm. (E) Evaluation of the pY397 FAK fluorescent signal in MDA-MB 231 cells treated with vehicle or IGF-1. (F) Fluorescence images of SUM159 cells exposed for 30 min to IGF-1 (50 ng/mL). Anti-pY397 FAK staining was detected in green and nuclei were stained with DAPI. Yellow arrows indicate focal adhesions. Scale bars, 10 µm. (G) Evaluation of the pY397 FAK fluorescent signal in SUM159 cells treated with vehicle or IGF-1. (H) Immunoblots showing the AKT phosphorylation in MDA-MB 231 and SUM159 TNBC cells treated for 30 min with IGF-1 (50 ng/mL) alone or in combination with the IGF-1R inhibitor OSI-906 (1 µM). Underlying panels show densitometric analysis of the immunoblots normalized to the loading control. (I) Immunoblots showing the AKT phosphorylation in MDA-MB 231 and SUM159 TNBC cells treated for 30 min with IGF-1 (50 ng/mL) alone or in combination with the FAK inhibitor VS-4718 (100 nM). Underlying panels show densitometric analysis of the immunoblots normalized to the loading control. (J) Immunoblots showing the phosphorylation of both AKT and FAK in MDA-MB 231 and SUM159 TNBC cells treated for 30 min with IGF-1 (50 ng/mL) alone or in combination with the PI3K inhibitor Wortmannin (1 µM). Underlying panels show densitometric analysis of the immunoblots normalized to the loading control. Immunoblots of IGF-1R after immunoprecipitation (IP) of FAK in MDA-MB 231 (K) and SUM159 (L) cells treated with IGF-1 (50 ng/mL) for 30 min. Western blotting of FAK is also shown. Immunoblots of FAK after immunoprecipitation (IP) of IGF-1R in MDA-MB 231 (M) and SUM159 (N) cells treated for 30 min with IGF-1 (50 ng/mL). Western blotting of IGF-1R is also shown. Underlying panels show densitometric analysis of the immunoblots normalized to the loading control. Data shown are representative of three independent experiments performed in triplicate. * indicates p < 0.05 for cells treated with vehicle versus treatments.

