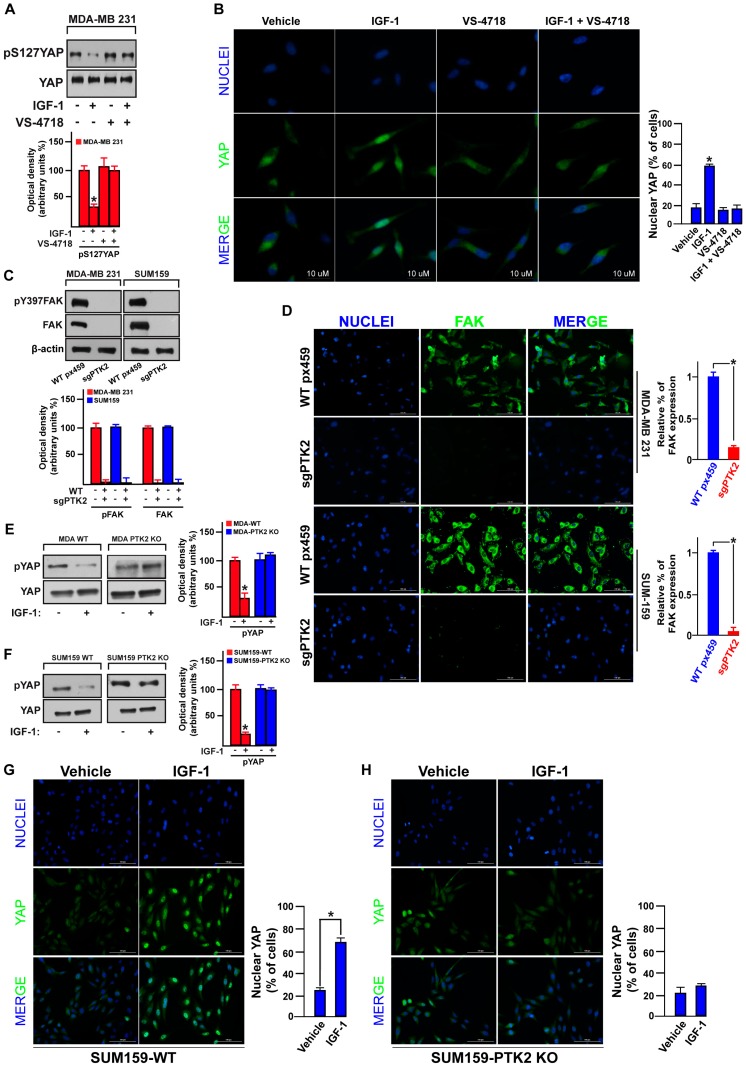
Figure 5.
FAK is involved in the IGF-1 induced YAP nuclear translocation. (A) Immunoblot showing the phosphorylation of YAP in MDA-MB 231 cells treated for 30 min with IGF-1 (50 ng/mL) alone or in combination with the FAK inhibitor VS-4718 (100 nM). Underlying panels show densitometric analysis of the immunoblots normalized to the loading control. (B) Immunofluorescence staining of YAP (green) and DAPI (blue) in MDA-MB 231 cells treated for 30 min with IGF-1 (50 ng/mL) alone or in combination with the FAK inhibitor VS-4718 (100 nM). Scale bars, 10 µm. Percentage of MDA-MB 231 cells with nuclear YAP is also shown. (C) Immunoblots showing CRISPR/Cas9-PTK2 knockout in MDA-MB 231 and SUM159 cells. Underlying panels show densitometric analysis of the immunoblots normalized to the loading control. (D) Immunofluorescence staining depicting CRISPR/Cas9-PTK2 knockout in MDA-MB 231 and SUM159 cells. Scale bars, 100 µm. FAK fluorescent signal in MDA-MB 231 and SUM159 cells is also shown. Immunoblots showing YAP phosphorylation in MDA-MB 231 WT and PTK2 KO cells (E) and in SUM159 WT and PTK2 KO cells (F) upon IGF-1 stimulation (50 ng/mL). Side panels show densitometric analysis of the immunoblots normalized to the loading control. Immunofluorescence staining of YAP (green) and DAPI (blue) upon 30 min IGF-1 stimulation (50 ng/mL) in SUM159 WT (G) and PTK2-KO cells (H). Scale bars, 100 µm. Percentage of SUM159 WT and PTK2-KO cells with nuclear YAP is also shown. Data shown are representative of three independent experiments performed in triplicate. Error bars represent mean ± SD. * indicates p < 0.05 for cells treated with vehicle versus treatments.

