Figure 7.
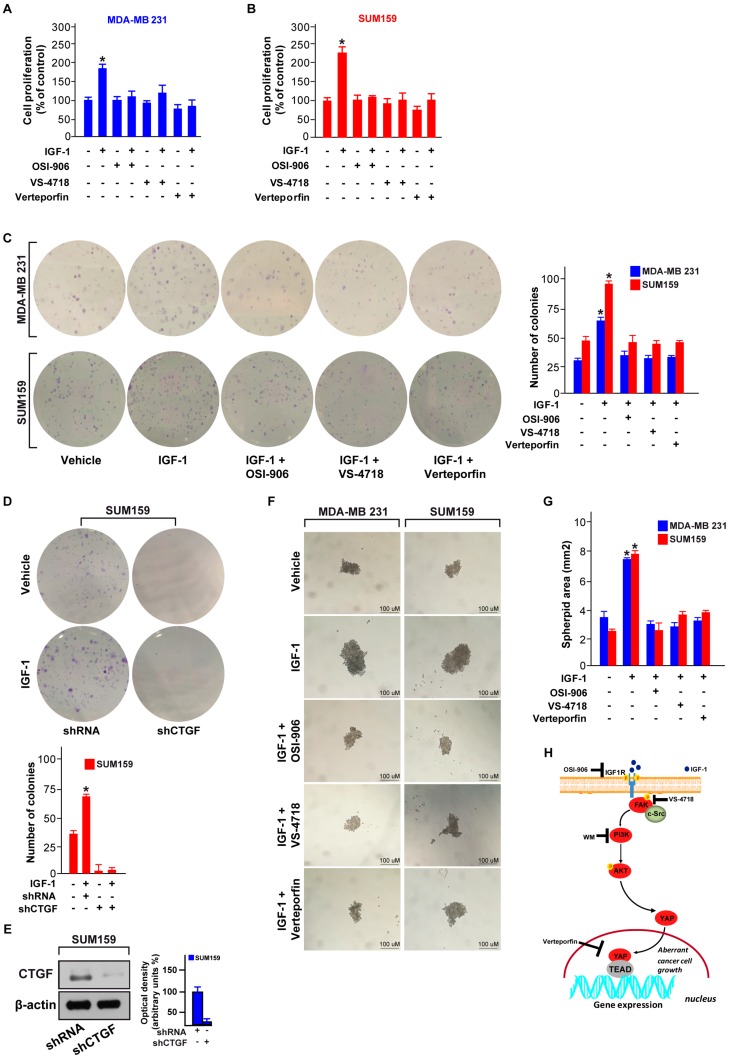
The IGF-1/FAK/YAP signaling pathway triggers the growth of TNBC cells. Proliferation assay of MDA-MB 231 (A) and SUM159 (B) cells exposed for 4 days to IGF1 (50 ng/mL) alone and in combination with the IGF-1R inhibitor OSI-906 (1 µM), the FAK inhibitor VS-4718 (100 nM) or the YAP/TEAD inhibitor, verteporfin (100 nM). (C) Colony formation assay in MDA-MB 231 and SUM159 cells exposed to IGF1 (50 ng/mL) alone and in combination with the IGF-1R inhibitor OSI-906 (1 µM), the FAK inhibitor VS-4718 (100 nM) or the YAP/TEAD inhibitor verteporfin (100 nM). After 10 days of treatment, the plates were stained with crystal violet and colonies were counted, as indicated. (D) Colony formation assay in SUM159 cells exposed to IGF-1 (50 ng/mL) and transfected with shRNA or shCTGF. After 10 days of treatment the plates were stained with crystal violet and colonies were counted, as indicated. (E) Immunoblot showing the CTGF protein levels in SUM159 cells transfected with control shRNA or shCTGF. Side panels show densitometric analysis of the immunoblot normalized to the β-actin, which was used as loading control. (F,G) Spheroid formation assay in MDA-MB 231 and SUM159 cells exposed for 18 days to IGF-1 (50 ng/mL) alone and in combination with the IGF-1R inhibitor OSI-906 (1 µM), the FAK inhibitor VS-4718 (100 nM) or the YAP/TEAD complex suppressor verteporfin (100 nM). Scale bars, 100 µm. (H) Cartoon depicting the IGF-1/FAK/YAP signaling pathway promoting gene expression changes and the growth of TNBC cells. Data shown are representative of three independent experiments performed in triplicate. Error bars represent mean ± SD. (*) indicates p < 0.05 for cells treated with vehicle versus treatments.

