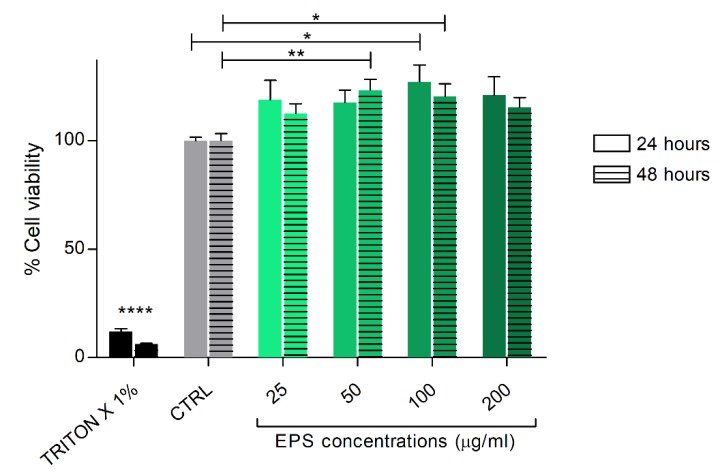
Figure 2.
Cell viability analysis after HSF cells treatment with EPS from Phormidium sp. ETS05. The cells were cultured with the indicated concentrations of EPS for 24 and 48 h. Cell viability was assessed. Data are shown as the mean ± SEM of three independent experiments, each carried out in triplicate. Statistical analysis was performed using GraphPad Prism 7 (one-way ANOVA, Tukey’s multiple comparison test). Statistical significance: * p ≤ 0.05, ** p ≤ 0.01, **** p ≤ 0.0001

