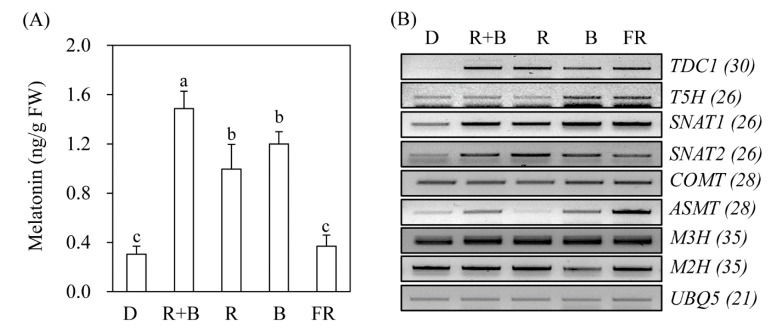
Figure 2.
Effects of light wavelength on melatonin synthesis and expression levels of corresponding genes. (A) Effects of light quality on melatonin synthesis. (B) Expression levels of melatonin biosynthetic and catabolic genes. Dehusked rice seeds were germinated and grown in half-strength Murashige and Skoog (MS) medium for 7 days under continuous light conditions as described in Figure 1. TDC1, tryptophan decarboxylase 1; T5H, tryptamine 5-hydroxylase; SNAT, serotonin N-acetyltransferase; COMT, caffeic acid O-methyltransferase; ASMT, N-acetylserotonin O-methyltransferase; M3H, melatonin 3-hydroxylase; M2H, melatonin 2-hydroxylase, UBQ5, ubiquitin 5. Values are means ± standard deviations of three independent experiments. FW, fresh weight. Different letters denote significant differences as determined by Tukey’s post hoc HSD test at P < 0.05. Numbers in parentheses are the numbers of polymerase chain reaction (PCR) cycles. GenBank accession numbers are AK069031 (TDC1), AK071599 (T5H), AK059369 (SNAT1), AK068156 (SNAT2), AK064768 (COMT), AK072740 (ASMT1), AK067086 (M3H), AK119413 (M2H), and Os03g13170 (UBQ5).

