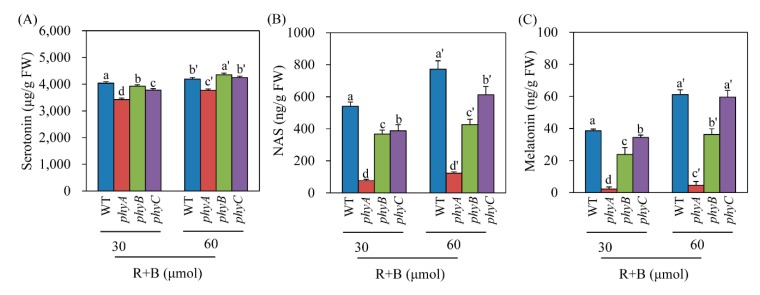
Figure 5.
Effects of light intensity on (A) serotonin, (B) N-acetylserotonin, and (C) melatonin levels in phy mutants in response to cadmium treatment under two light intensity conditions. Seven-day-old rice seedlings were rhizosperically challenged with 0.5 mM CdCl2 for 3 days under two different continuous light intensity conditions. Light intensity (R + B) was either 30 or 60 μmol × m−2 × s−1. Values are means ± standard deviations of three independent experiments. FW, fresh weight. Different letters denote significant differences as determined by Tukey’s post hoc HSD test at P < 0.05.

