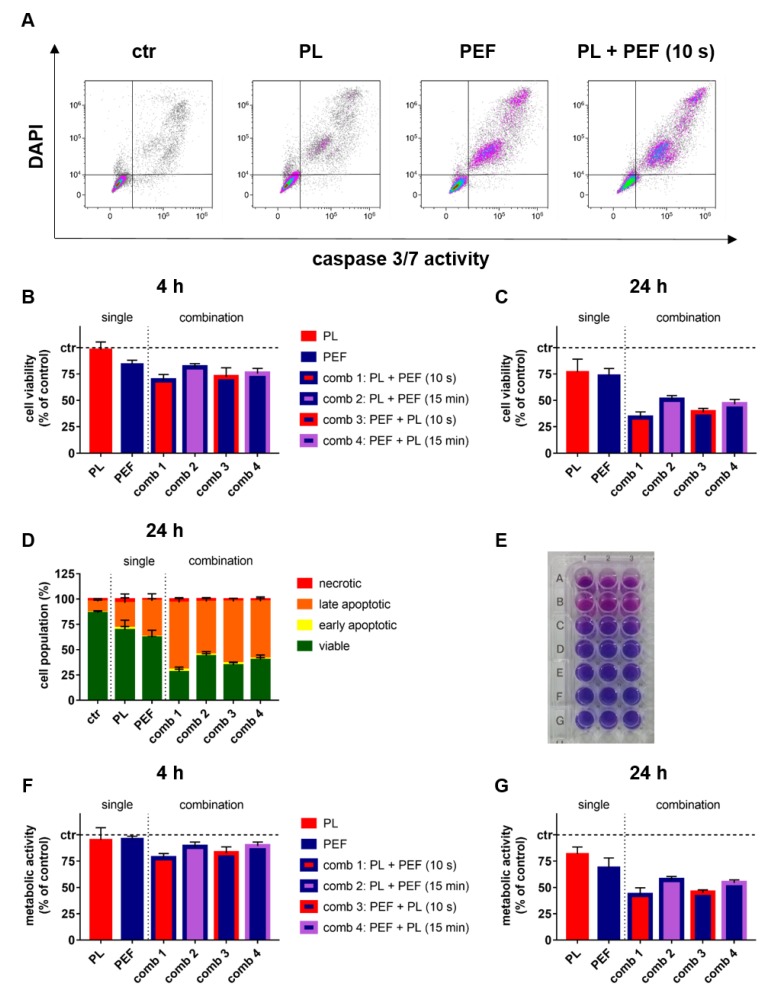
Figure 3.
Cell viability and metabolic activity at 4 and 24 h after mono and combination treatments. The plasma exposure time was 40 s, and the electric field strength was 0.9 kV/cm. Percentages of viable, early, and late apoptotic, as well as necrotic cells were analyzed (A) and quantified (B–D) at 4 and 24 h using flow cytometry. The cell viability at 4 (B) and 24 h (C) is shown. The resazurin assay (E) was utilized to analyze the metabolic activity at 4 (F) and 24 h (G). The results of the t-test for the cell viability and metabolic activity are shown in Table 2 and Table 3, respectively. Data are shown as one representative (A,E) or mean + S.E. (B–D,F,G) of three independent experiments. ctr = control; PL = plasma; PEF = pulsed electric fields; comb = combination.

