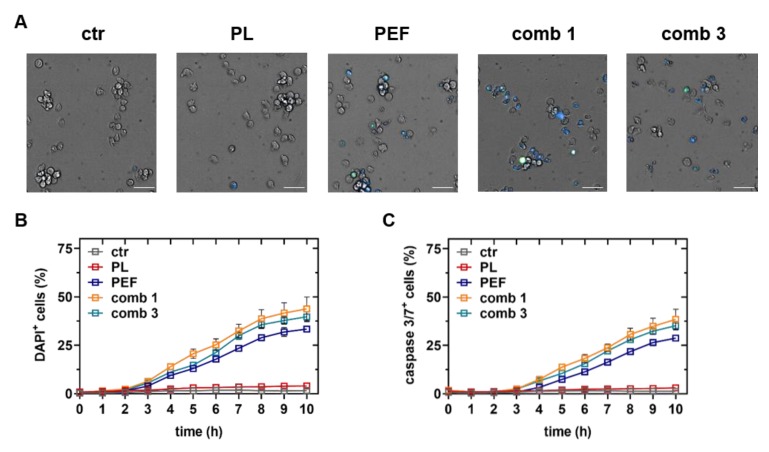
Figure 4.
Cell death kinetics using live-cell imaging. The plasma-exposure time was 40 s, and the electric field strength was 0.9 kV/cm. Representative images of brightfield, caspase 3/7 (green), and 4′,6-diamidino-2-phenylindole (DAPI, blue) intensities 10 h after treatment of control, plasma, PEF, plasma plus PEF, and PEF plus plasma treatment (A). Quantitative analysis of DAPI (B) indicative of terminally dead cells and caspase 3/7 (C) indicative of apoptotic cells. Data are shown as one representative (A) and mean + S.E. (B,C) of three technical replicates from three independent experiments. ctr = control; PL = plasma; PEF = pulsed electric fields; comb = combination. Scale bar is 50 µm.

