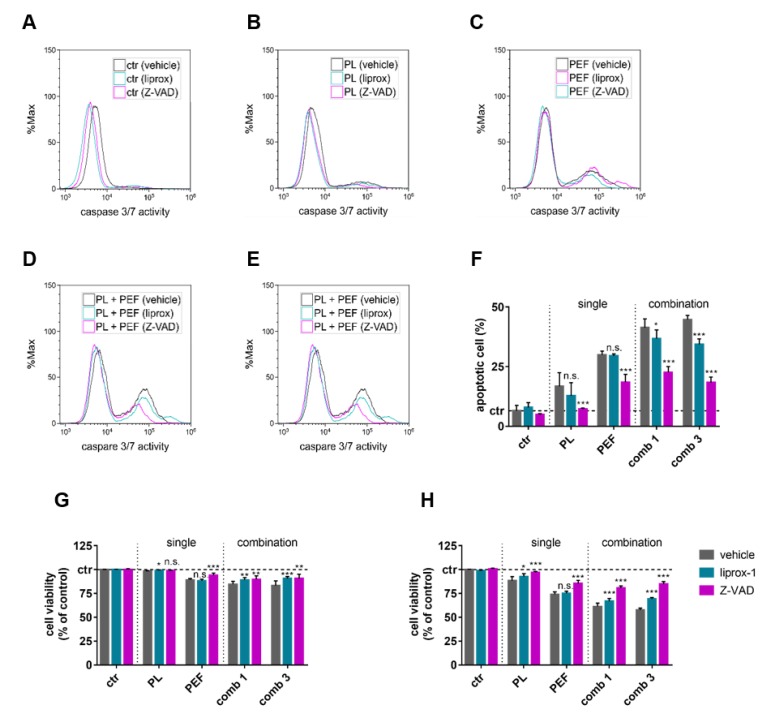
Figure 7.
Influence of cell death inhibitors on cell viability after mono and combination treatments. The plasma exposure time was 40 s, and the electric field strength was 0.9 kV/cm. The cells were pretreated with liproxstatin-1 (liprox-1) or Z-VAD-FMK (Z-VAD) and stained with CellEvent Caspase-3/7 Green Detection Reagent 24 h after control conditions (A), plasma treatment (B), PEF treatment (C), plasma plus PEF treatment (D), or PEF plus plasma treatment (E). Apoptotic cells (caspase 3/7 active cells) were quantified 24 h after the treatments (F), as well as the cell viability after 4 (G) and 24 h (H). The significant differences of cells without any antioxidants compared to the liprox-1 and Z-VAD pretreated cells were determined by t-test. Data are shown as one representative (A–E) or mean + S.E. (F–H) of three independent experiments. ctr = control; PL = plasma; PEF = pulsed electric fields; comb = combination; n.s. = not significant.

