Figure 5.
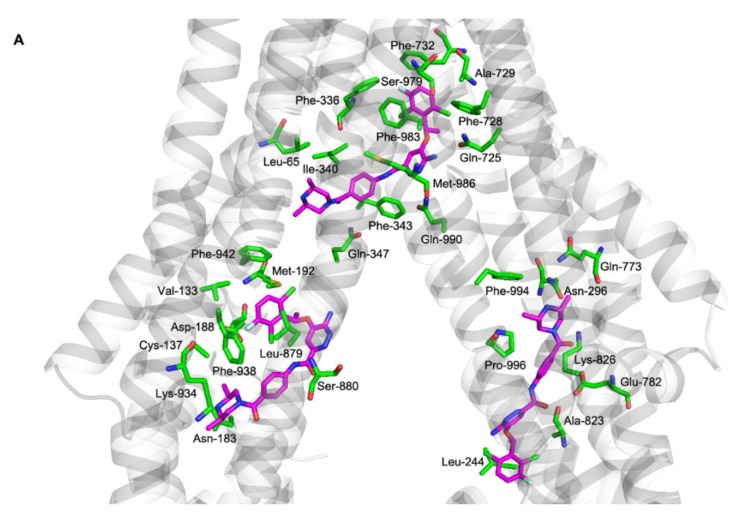
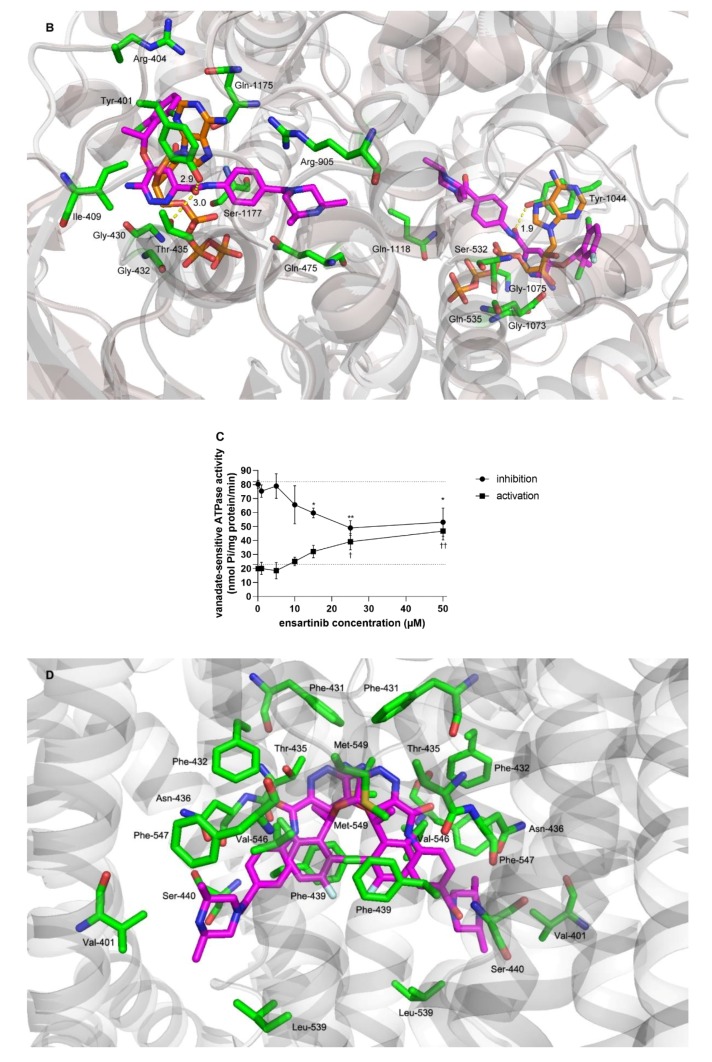
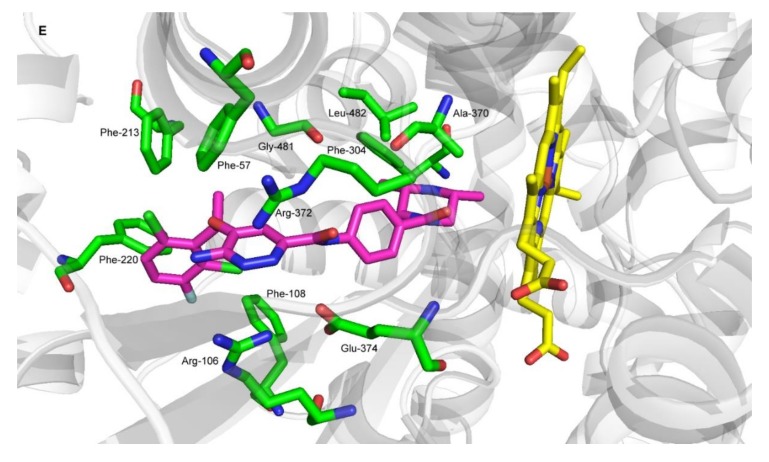
Flexible molecular docking of ensartinib into ABCB1, ABCG2, and CYP3A4 structures and analysis of ensartinib’s interactions with ABCB1 ATPase domain using ATPase assay. (A) Molecular docking of ensartinib into the inward-facing form of ABCB1. The top-ranked poses of ensartinib (−12.6, −9.5, and −9.3 kcal/mol) are shown for M-, H-, and R-sites, respectively. Ensartinib is shown in magenta, and protein residues within 4 Å of the ligand are shown as green sticks and labeled. (B) Flexible molecular docking of ensartinib into nucleotide binding domains (NBDs) of the outward-facing form of ABCB1. Ensartinib is shown in magenta, and the ATP molecule that originally co-crystallized with the protein backbone is shown using orange sticks. Residues within 4 Å are green, predicted H-bonds are depicted as yellow dashed lines. (C) Effects of ensartinib on the vanadate-sensitive ATPase activity of ABCB1-Sf9 membrane fraction. Lower dotted line represents baseline vanadate-sensitive ATPase activity, while upper dotted line shows activated ATPase activity triggered by a reference substrate verapamil. In the inhibition and activation experiments, reductions in the stimulated ATPase activity (indicating inhibitory interaction of the drug toward ABCB1’s ATPase) and increases in baseline ATPase activity (indicating substrate properties of the drug) were recorded, respectively. Statistical analysis of differences between stimulated control and ensartinib-treated samples in inhibition assays (* p < 0.05; ** p < 0.01) as well as analysis of differences between baseline control and ensartinib-treated samples in activation experiments († p < 0.05; †† p < 0.01) were determined using two-tailed unpaired t test. Data are expressed as means ± SDs from three independent experiments. (D) Two possible orientations of ensartinib in ABCG2 identified by flexible docking analysis (−12.9 and −12.5 kcal/mol). ABCG2 protein residues predicted to be within 4 Å of ensartinib are show as green sticks. (E) Binding of ensartinib to the CYP3A4 structure. Ensartinib is shown in magenta, heme in yellow, and protein residues surrounding the ligand are depicted as green sticks.


