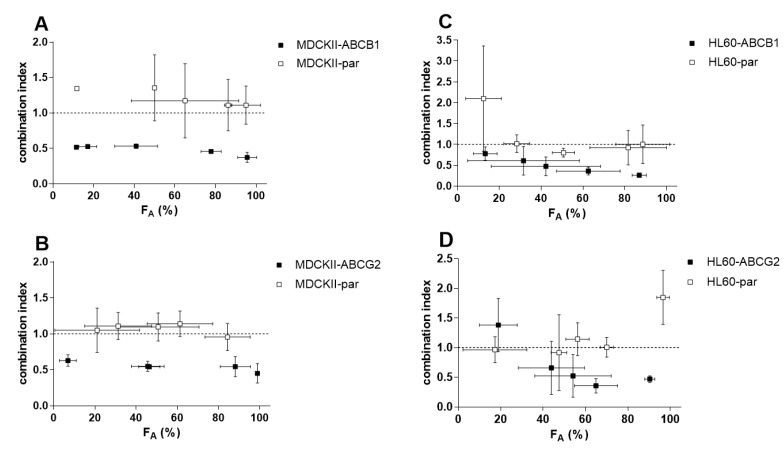
Figure 7.
FA-combination index (CI) plot for the combinations of 10 µM ensartinib with daunorubicin or mitoxantrone in MDCKII-ABCB1/HL60-ABCB1 (A,C) and MDCKII-ABCG2/HL60-ABCG2 (B,D) cells, respectively. The results obtained with the same combinations in the parental cell lines are also shown. FA-CI plots were generated by using CompuSyn software to analyze the combination data shown in Figure 6 and ensartinib proliferation data (not shown). Combination outcomes can be synergistic (CI < 0.9), additive (0.9 < CI < 1.1), or antagonistic (CI > 1.1). The plotted data points are means ± SD from at least three independent experiments.

