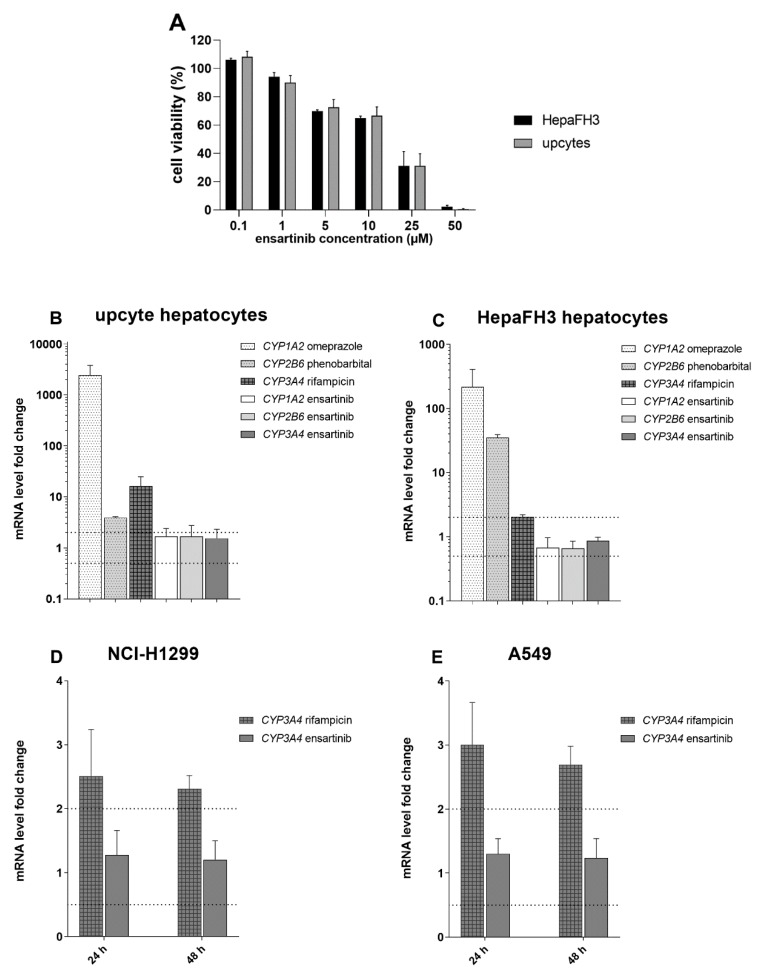
Figure 12.
Effect of ensartinib on CYP1A2, CYP2B6 and CYP3A4 expression. Studies on its potential to perpetrate drug-drug interactions (DDIs) were performed in physiological models, namely upcyte (B) and HepaFH3 (C) hepatocytes. Assessments of possible changes in MDR phenotype were performed in the NSCLC cellular models NCI-H1299 (D) and A549 (E). The tested ensartinib concentration (0.5 µM) was chosen based on previously determined Cmax values and cell viability measurements (A). For hepatic models, cells were incubated with 0.5 µM ensartinib or with the model inducers omeprazole (50 µM), phenobarbital (750 µM), or rifampicin (25 µM). After 72 h, the mRNA levels of the chosen genes were analyzed by qRT-PCR. The NSCLC cells were incubated with 0.5 µM ensartinib or 25 µM rifampicin for 24 and 48 h, after which the mRNA levels of CYP3A4 were evaluated by qRT-PCR. The boundaries of downregulation/upregulation positivity based on the EMA’s recommendations are indicated by dotted lines. The plotted data are means ± SD based on at least three independent experiments.

