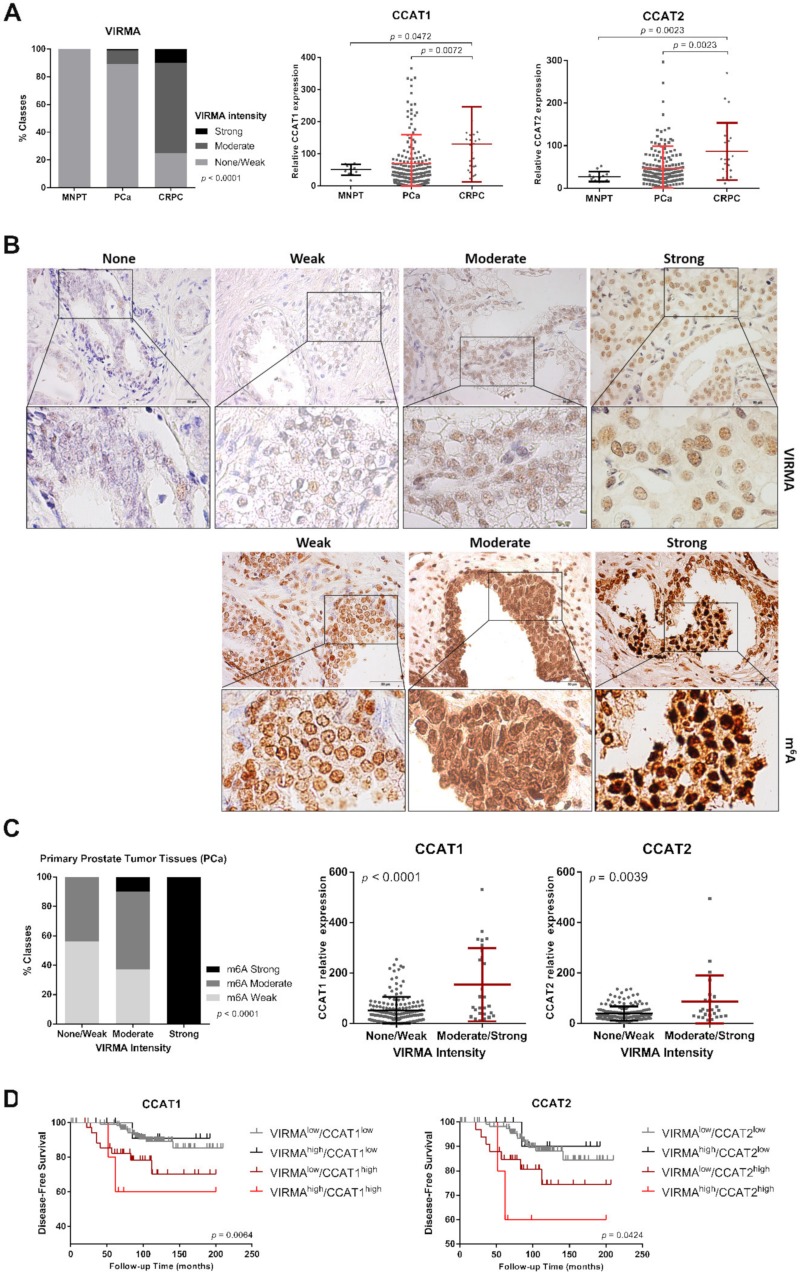
Figure 7.
VIRMA, CCAT1, and CCAT2 are overexpressed in PCa tissues and associate with poor prognosis. (A) On the left, the contingency graph displaying the immunostaining intensity of VIRMA (chi-square test) and, on the right, the scatter plot representing the relative lncRNA expression (Mann–Whitney U test) in morphologically normal prostate tissue (MNPT), hormone-naïve PCa (PCa) and castration-resistant PCa (CRPC); (B) Representative images of VIRMA and m6A immunostaining in the IPO-Porto patient cohort; (C) m6A immunostaining intensity and relative lncRNA expression in hormone-naïve PCa tissues stratified according to VIRMA immunostaining intensity; (D) Kaplan–Meier survival curves of VIRMA and CCAT1/2, log-rank test.

