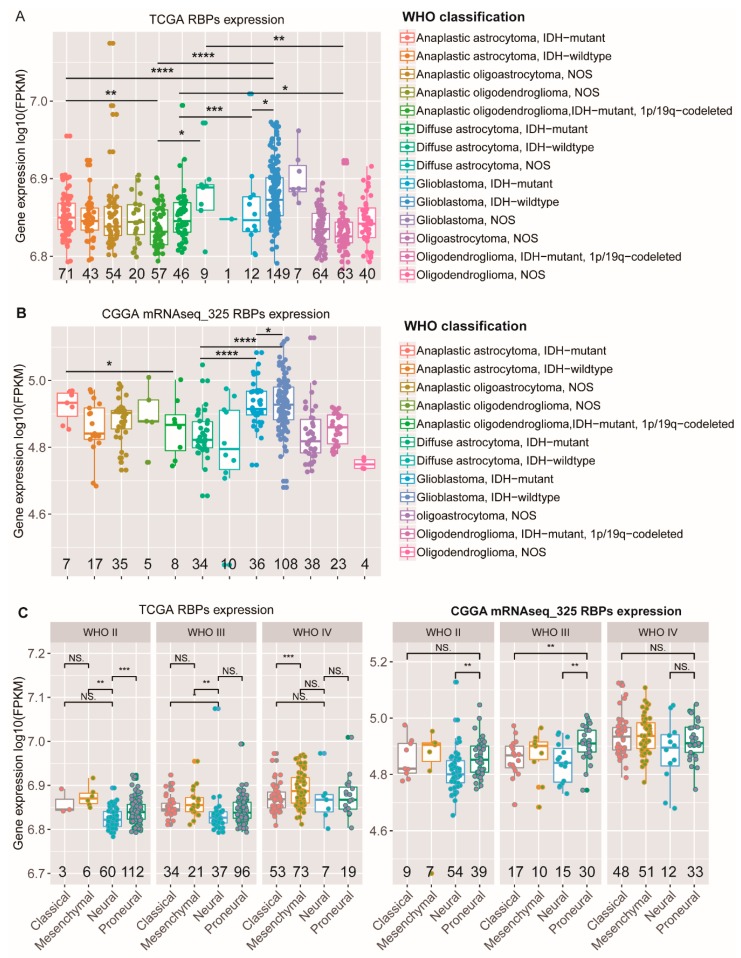
Figure 2.
Associations between the expression of RBPs and molecular or clinical features in glioma patients. (A,B) RBPs’ normalized expression of different WHO classification gliomas in the TCGA (A) and CGGA (B) datasets. (C) RBPs normalized expression, stratified by the molecular subtype in TCGA glioma patients (left) and CGGA gliomas (right). (The p-values were calculated using a Wilcoxon test by R (version 3.4.1), * p < 0.05, ** p < 0.01, *** p < 0.001, **** p < 0.0001, NS: No significance, the numbers under all the graphs show the amount of samples.).

