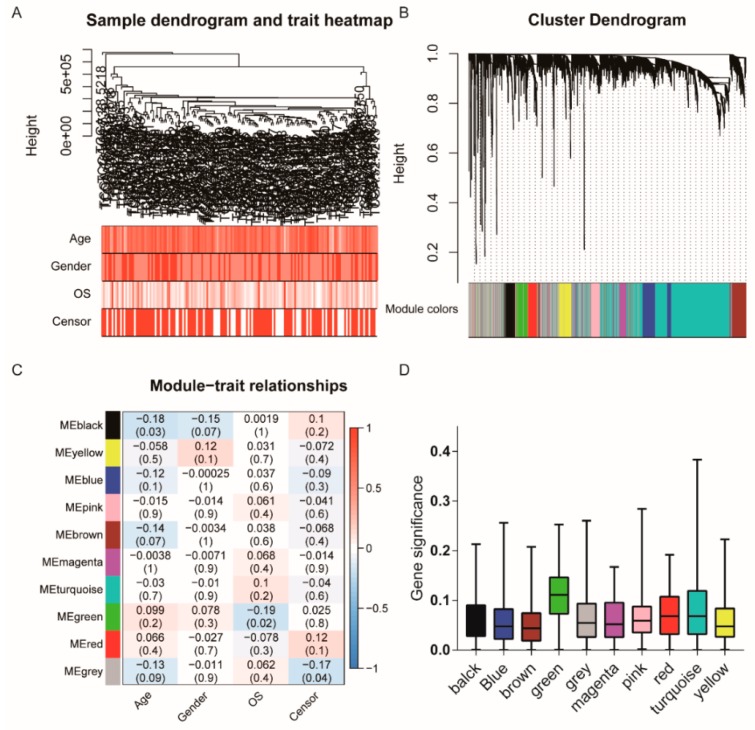
Figure 4.
Co-expression Network modules of RBPs identified by WGCNAs and survival analysis. (A) cluster tree of human GBM samples in TCGA. The color band underneath the tree indicates the numeric values of the tissue traits, (B) Cluster Dendrogram indicating different RNA-binding protein modules. (C) The heat map visualizes the correlation between the modules and the patient’s clinical characteristics. The values indicate the correlation and p-value in squares. A positive score indicates a positive correlation. (D) The distribution of the average gene significance in different modules is shown.

