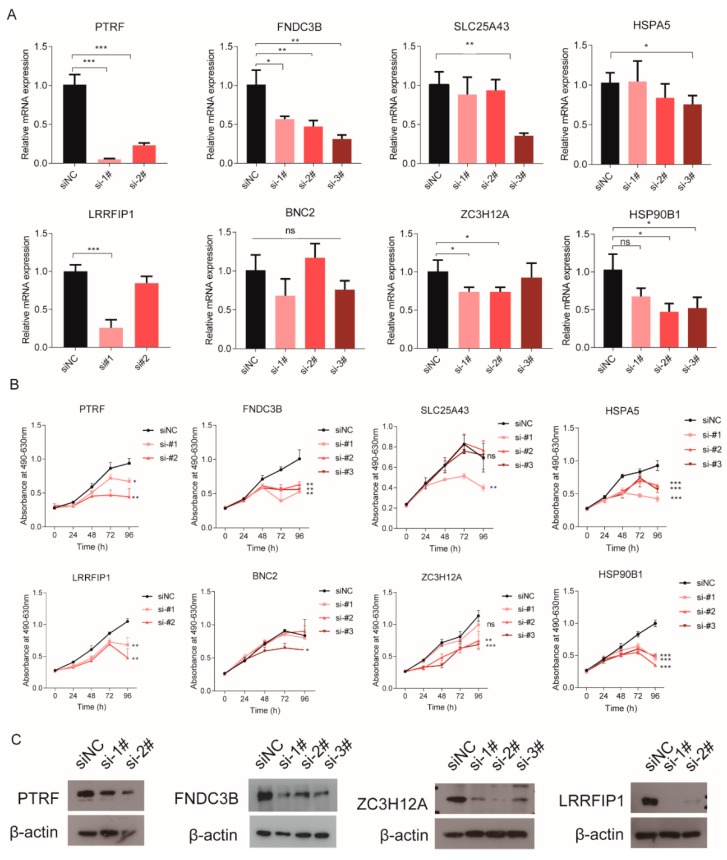
Figure 6.
An MTS assay was used to measure the proliferation of the LN229 cell. (A) real-time quantitative PCR for the expression of eight RBPs in different groups, (B) proliferation of the LN229 cell after knocking down eight RBPs, (C) Western blot used to detect the knockdown effect of PTRF, FNDC3B, ZC3H12A, and LRRFIP1 (siNC: Negative Control; si-1#, si-2# and si-3#: They are different knockdown sequences of target genes, * p < 0.05, ** p < 0.01, *** p < 0.001).

