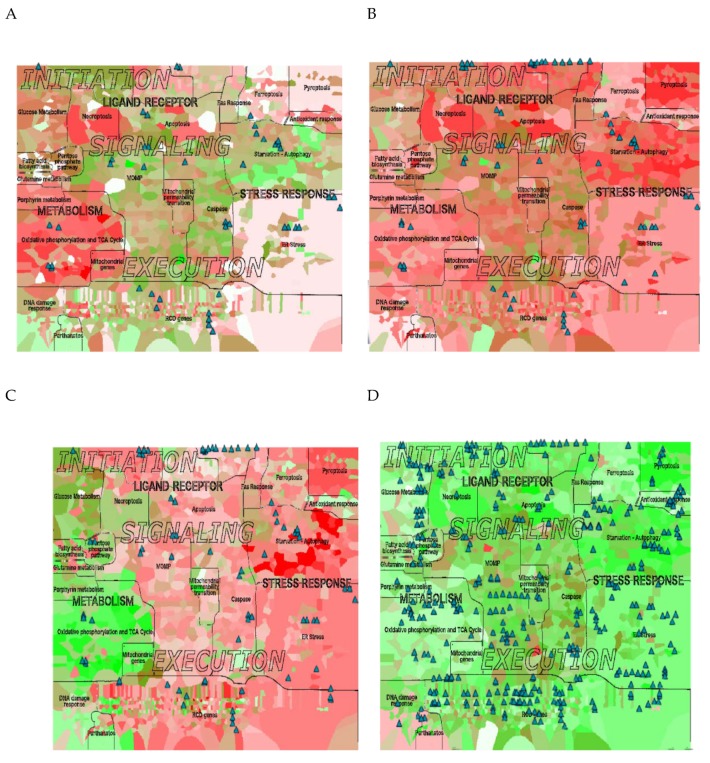
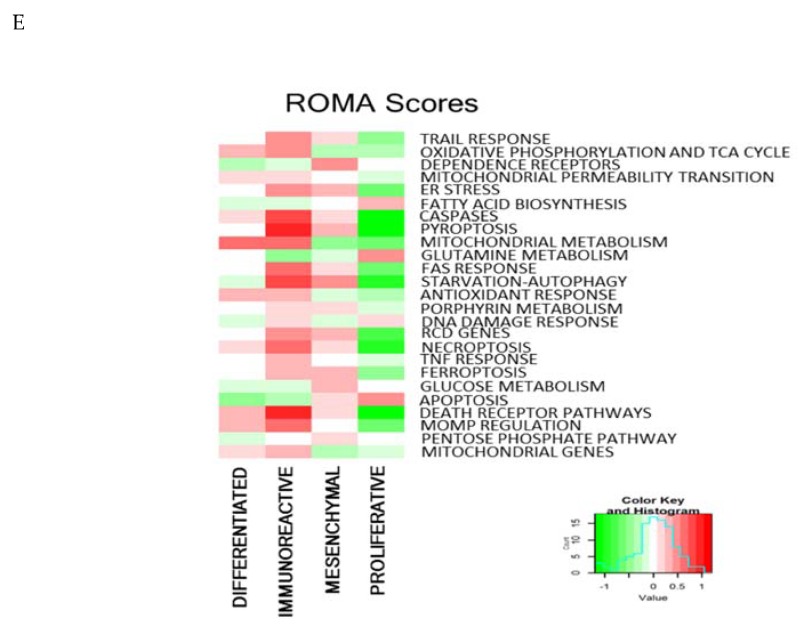
Figure 6.
Visualization of expression and genomic data from ovarian cancer groups. (A) differentiated, (B) mesenchymal, (C) immunoreactive, (D) proliferative subtype. The background color represents the expression value per protein (red: up-regulated, green: down-regulated). The glyphs (triangles) represent gene copy number gains above 4 copies. (E) Heat map of the ROMA scores per subtype.


