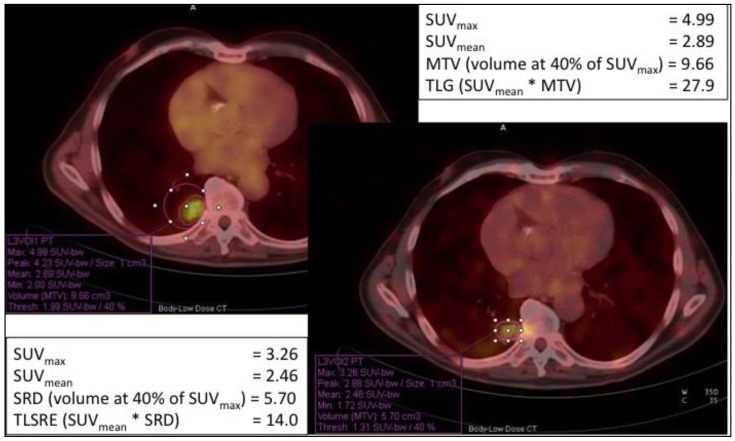
Figure 5.
New evaluation prognostic parameters for NETs comparing [18F]-FDG PET/CT (left image) and [68Ga]-DOTA-NOC imaging (right image). The same lesion was analyzed by both [18F]-FDG and [68Ga]-DOTA-NOC, measuring SUVmax, SUVmean for both PET scans, MTV and TLG for [18F]-FDG, SRD and TLSRE for [68Ga]-DOTA-NOC. Considering the same volume of lesion, TLG and TLSRE values reported differential expression of SSTR and glucose transporters (GLUT) in the lesion. SUV = Standard Uptake Value; MTV = Metabolic Tumor Volume; TLG = Total Lesion Glycolysis; SRD = Somatostatin Receptor Density; TLSRE = Total Lesion Somatostatin Receptor Expression.

