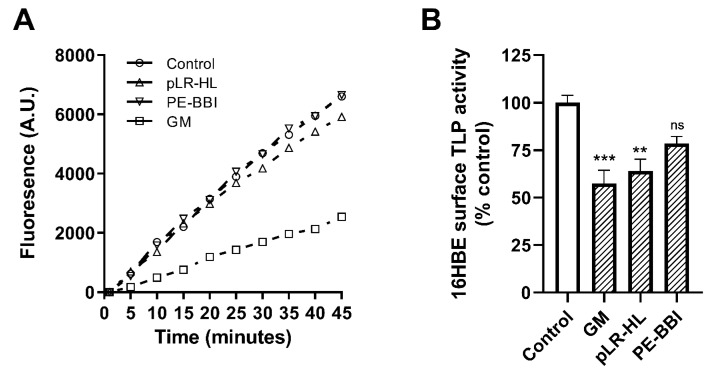
Figure 2.
Evaluation of protease inhibitors compounds on polarised 16HBE surface TLP activity. (A) Typical kinetic trace demonstrating TLP cell surface protease activity in the presence or absence of putative inhibitor compounds. Summary data are quantified in panel (B). Data are presented as the mean ± SEMs (n = 7). ** P < 0.01, *** P < 0.001, ns (not significant).

