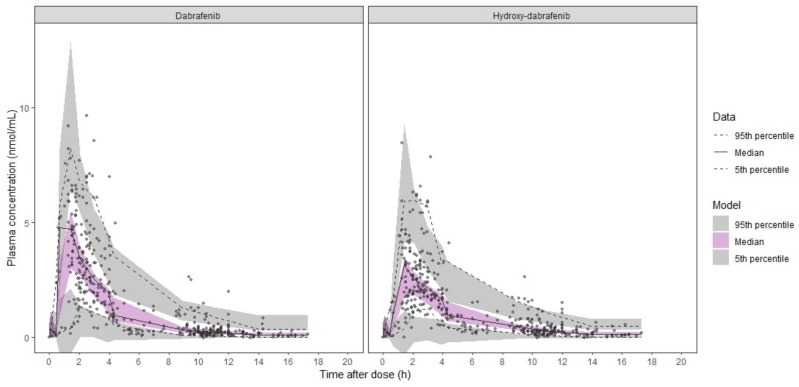
Figure 2.
Prediction-corrected visual predictive check of dabrafenib/hydroxy-dabrafenib final model. Dots, continuous, and dashed lines represent DAB (left panel) and OHD (right panel) prediction-corrected plasma concentrations with median and 90% percentile intervals, respectively. Shaded areas represent the 90% confidential intervals around the model-based 5%, 50%, and 95% percentiles.

