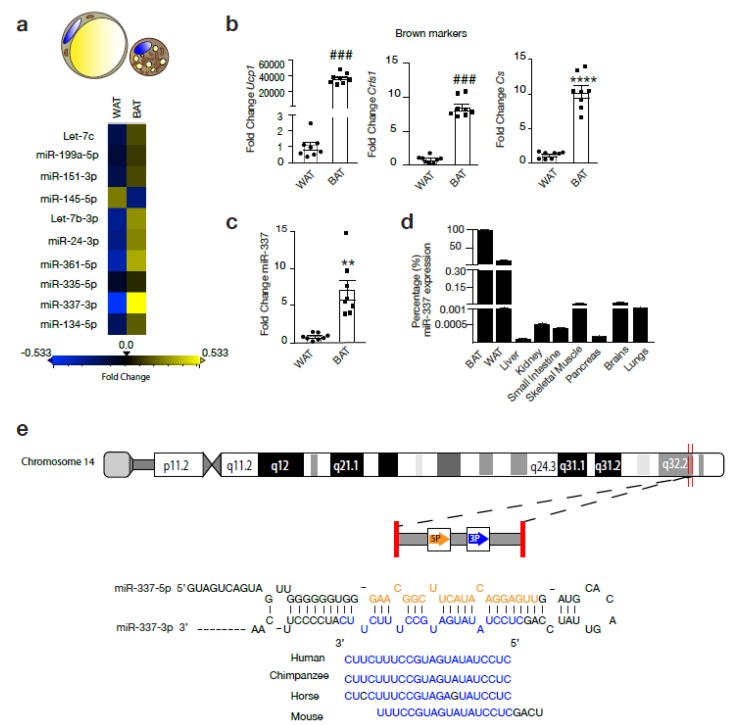
Figure 1.
miR-337-3p is a potential regulator of browning of adipose tissue. (a) Representative heatmap showing the results of RT-PCR analysis used to screen a panel of microRNAs (miR) in mouse white adipose tissue (WAT) and brown adipose tissue (BAT): Let-7c, miR-199a-5p, miR-151-3p, miR-145-5p, Let-7b-3p, miR-24-3p, miR-361-5p, miR-335-5p, miR-337-3p, miR-134-5p. Real-time PCR was performed using the miRCURY LNA miR PCR Assay and normalized to U6 RNA and relative to WAT. Differentially expressed miR (fold change ≥0.5) are indicated in yellow, which represents upregulated miRNA in BAT compared to WAT, and in blue are the downregulated miRs (fold change ≤−0.5) in BAT compared to WAT. N = 3/group. (b) RT-PCR analysis of transcript abundance of BAT thermogenic and mitochondrial markers Ucp1, Cs, and Crls1 in BAT compared to WAT. mRNA expression values were normalized to L7 mRNA. N = 8/group. (c) RT-PCR analysis of mmu-miR-337-3p expression in mouse WAT and BAT normalized to U6 RNA. N = 8/group (d) RT-PCR analysis of mmu-miR-337-3p abundance in BAT, WAT, liver, kidney, small intestine, skeletal muscle, pancreas, brains, and lungs presented as percentage of mmu-miR-337-3p transcript abundance from its expression in BAT. Expression of miR-337-3p in BAT is set to 100%. (e) Representative image of the genomic mapping of miR-337-3p in humans and conservation of its seed sequence among species. Data are presented as means ± SEM; individual data points are given by the dot plot. Either Mann–Whitney-U or Independent sample t-test was used to assess differences in expression levels. ### p < 0.001 Mann–Whitney-U, ** p < 0.01 **** p < 0.0001 Independent sample t-test, equal variances not assumed. n, number of biological replicas; WAT, white adipose tissue; BAT, brown adipose tissue; Ucp1, uncoupling protein-1; Crls1, cardiolipin synthase 1; Cs, Citrate synthase; RT-PCR, quantitative real time-polymerase chain reaction.

