Figure 2.
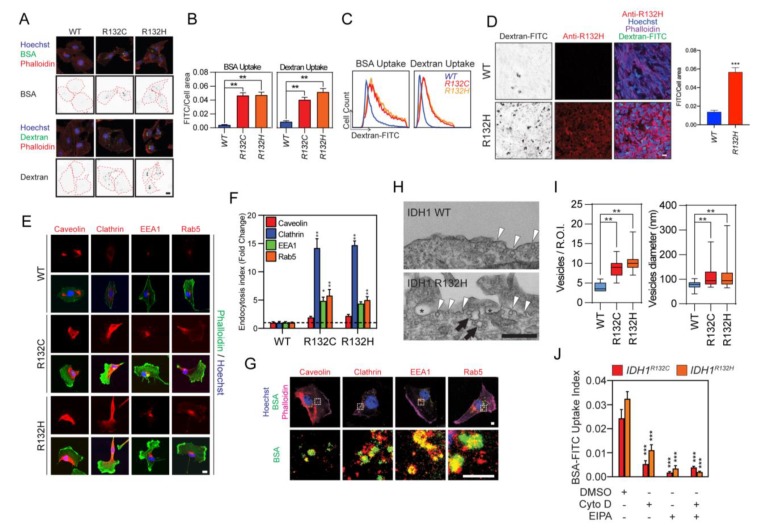
IDH1-mutated cells showed potentiated endocytosis. (A) Enhanced endocytosis in IDH1-mutated cells. Endocytosis was measured by high-molecular-mass fluorescein bovine serum albumin (BSA-FITC; green, upper panel) or high-molecular-mass fluorescein-dextran (dextran-FITC; green, lower panel) uptake assay. U251 IDH1R132C/H cells were probed with Hoechst 33,342 (blue) and Alexa Fluor 647-labeled phalloidin (red). Endocytosis vesicles were highlighted with a binary image. The cell boundary was labeled with a red dash line. Bar = 10 μm. Data quantification in Figure S3A. (B) Quantitative of BSA-FITC (IDH1WT, 0.004 ± 0.0004, n = 50; IDH1R132C, 0.047 ± 0.004, n = 39; IDH1R132H, 0.047 ± 0.004, n = 40) or dextran-FITC (IDH1WT, 0.009 ± 0.001, n = 57; IDH1R132C, 0.041 ± 0.004, n = 52; IDH1R132H, 0.052 ± 0.005, n = 48) uptake by quantitative image analysis for Figure 2A. t-test, ** p < 0.01. (C) Flow cytometry analysis of BSA-FITC or dextran-FITC uptake in U251 cells. (D) Dextran-FITC (green) uptake was measured in U251 IDH1WT or IDH1R132H xenografts in nude mice (IDH1WT, n = 2; IDH1R132H, n = 6); representative images are shown. IDH1 mutant was detected using an antibody targeting IDH1 R132H variant (red). The cell boundary was highlighted with phalloidin (purple). Dextran uptake was highlighted with a binary image. Cell nuclei were labeled with Hoechst 33,342 (blue). U251 IDH1WT: 0.014 ± 0.0017, n = 6; IDH1R132H: 0.057 ± 0.0048, n = 6. Bar = 20 μm. (E) Confocal microscopy showed endosomal markers caveolin, clathrin, Early Endosome Antigen 1 (EEA1), or Ras-related protein Rab-5 (Rab5, left panel). Quantification of endocytic vesicles in IDH1 transduced cells. Endocytic vesicles were labeled with primary antibodies against caveolin, clathrin, EEA1, or rab5. Bar = 10 μm. (F) The formation of a vesicle was calculated by averaging the area of the vesicle to the total area of the cell. IDH1WT: caveolin, 1.00 ± 0.16; clathrin, 1.00 ± 0.23; EEA1, 1.00 ± 0.19; Rab5, 1.00 ± 0.12. IDH1R132C: caveolin, 1.94 ± 0.21; clathrin, 14.2 ± 1.63; EEA1, 4.87 ± 0.66; Rab5, 5.80 ± 1.06. IDH1R132H: caveolin, 2.23 ± 0.25; clathrin, 14.7 ± 0.73; EEA1, 4.38 ± 0.32; Rab5, 5.01 ± 0.61. (n = 5). t-test, * p < 0.05, ** p < 0.01. (G) Confocal microscopy showed colocalization of internalized BSA-FITC (green) with endosomal markers caveolin, clathrin, EEA1, or Rab5 (red) in U251 IDH1R132H cell. Cell boundary was highlighted with phalloidin (purple); cell nuclei were labeled with Hoechst 33,342 (blue). Bar = 1 μm. (H) Representative TEM imaging showing cell surface of IDH1WT (upper panel) and IDH1R132H (lower panel) U251 cell. Endocytosis (arrowheads), fused endocytic vesicles (arrows), and macropinocytosis (star) was highlighted in the image. Bar = 500 nm. (I) Quantitative analysis of endocytosis vesicles (IDH1WT, 4.00 ± 0.33, n = 12; IDH1R132C, 9.09 ± 0.73, n = 11; IDH1R132H, 10.5 ± 0.90, n = 11; ROI: region of interest) and the diameter of vesicles (IDH1WT, 76.2 ± 2.65, n = 31; IDH1R132C, 109 ± 5.53, n = 54; IDH1R132H, 105 ± 5.84, n = 49) in IDH1 mutant U251 cells based on TEM images. t-test, ** p < 0.01. (J) Immunofluorescence staining showed BSA-FITC uptake in IDH1R132C/H cells. Cells were pretreated with 5 μM cytochalasin D or 20 μM Ethylisopropyl amiloride (EIPA) for 2 h. Cells were incubated with BSA-FITC at a final concentration of 1 mg/mL for 60 min. IDH1R132C: Dimethyl sulfoxide (DMSO), 0.024 ± 0.0036, n = 35; Cytochalasin D (CytoD), 0.0053 ± 0.001, n = 51; EIPA, 0.0017 ± 0.0003, n = 52; CytoD + EIPA, 0.0039 ± 0.0005, n = 54. IDH1R132H: DMSO, 0.033 ± 0.0029, n = 42; CytoD, 0.011 ± 0.0022, n = 41; EIPA, 0.0034 ± 0.0012, n = 50; CytoD + EIPA, 0.0020 ± 0.0003, n = 51. t-test, *** p < 0.001.

