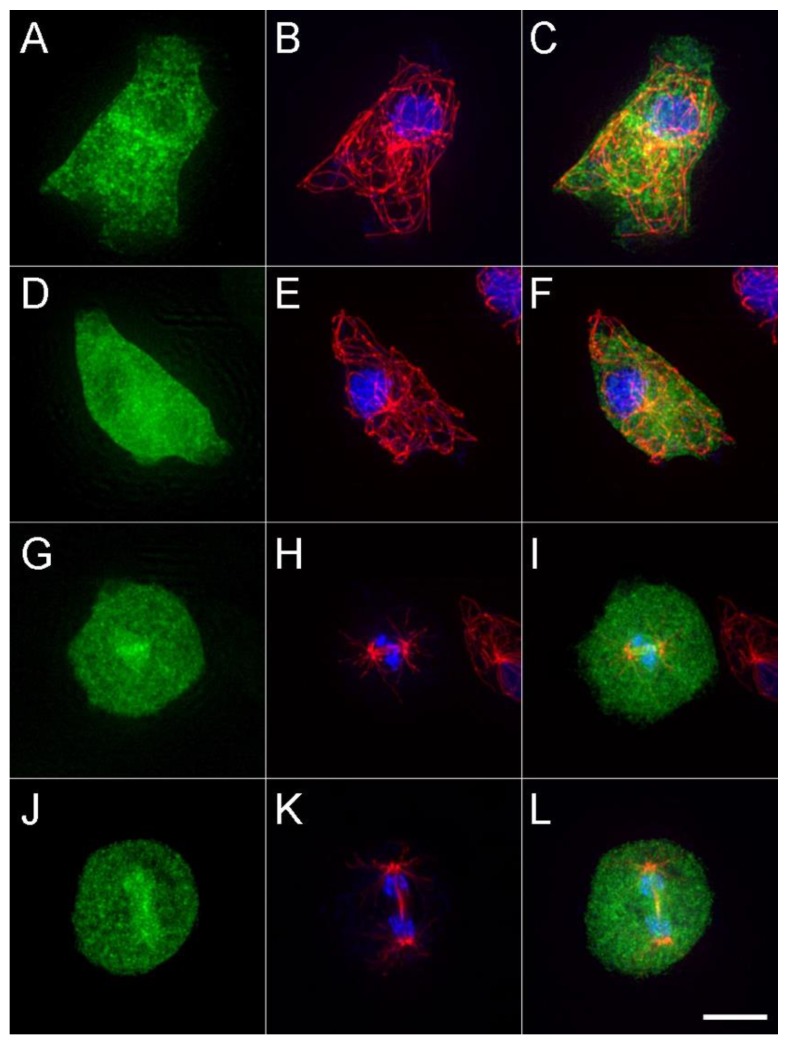
Figure 3.
The cellular distribution of DdKif10725. The left column (green) shows the maximum intensity projections of the DdKif10 distribution in two interphase (A,D) and two mitotic cells (G,J). Antibody-labelled MTs (red) and Hoechst-stained nuclei (blue) are shown in the middle column (panels B,E,H,K), and the two frames are merged in the right column (panels C,F,I,L). Scale bar = 5 μm.

