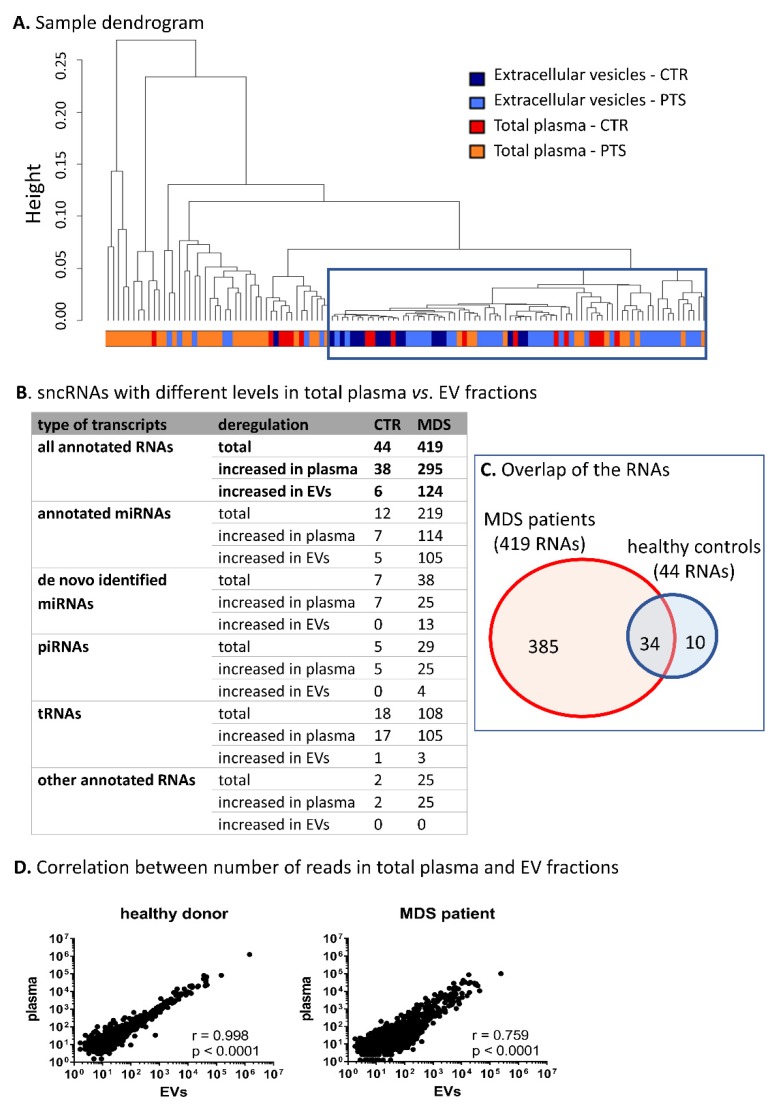
Figure 2.
Characterization of circulating small noncoding RNA (sncRNA) profiles of total plasma vs. EVs. (A) Hierarchical cluster analysis of samples based on all RNA-seq data. The blue frame highlights the clustered extravesicular samples. CTR—healthy controls, PTS—MDS/AML patients. (B) SncRNAs with different levels between total plasma and paired EV samples. Only the RNAs with |logFC| >1 and q < 0.05 were considered. (C) The overlap of the RNAs between MDS patients and healthy controls. (D) Correlation between normalized number of reads in total plasma vs. paired EV samples in a typical healthy control or an MDS patient.

