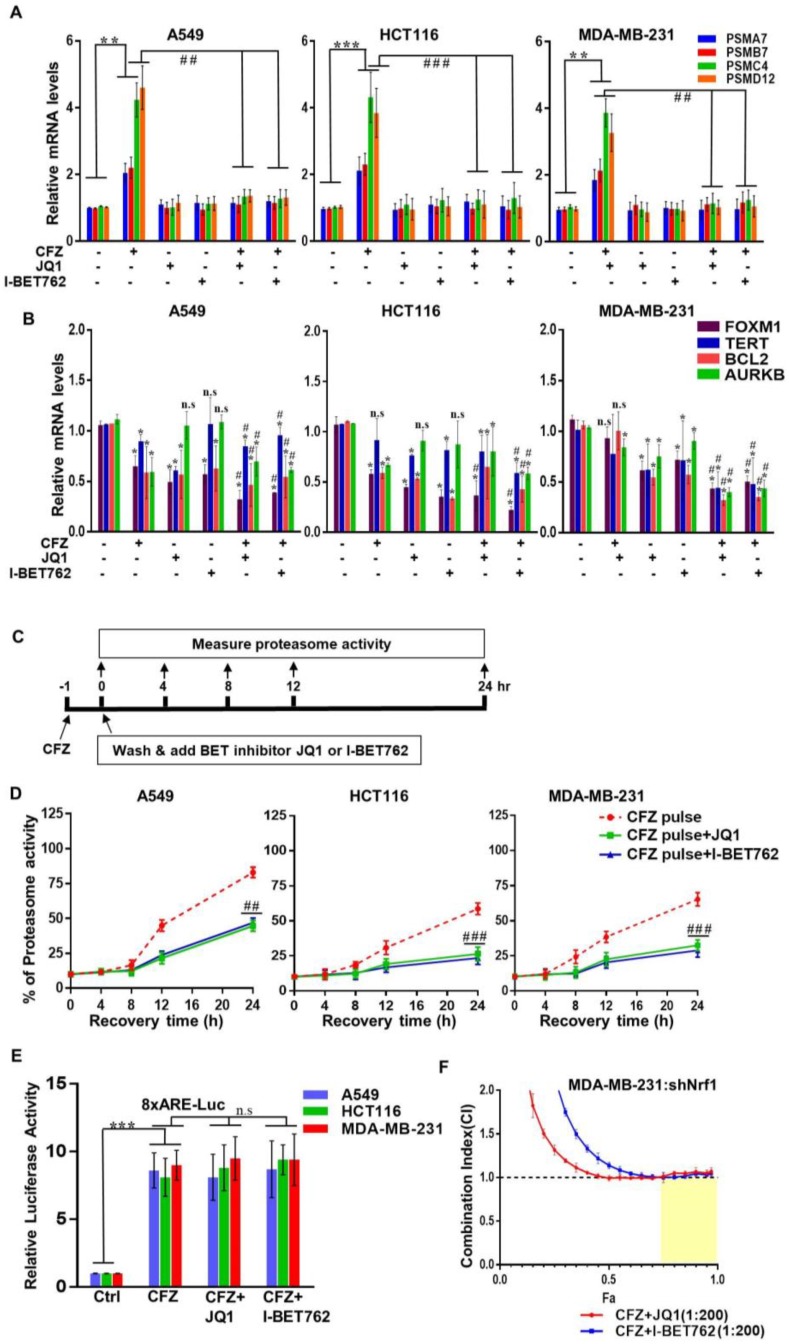
Figure 2.
BET inhibitors impair Nrf1-mediated induction of proteasome genes and recovery of proteasome activity in response to CFZ. The A549, HCT116, and MDA-MB-231 cells were treated with CFZ (200 nM) alone and in combination with I-BET762 (10 µM) and JQ1 (1 µM) for 8 h. The DMSO treatment was used as vehicle control. Following treatments, RNA was extracted from cells and analyzed for representative proteasome subunit (A), BET target (B) mRNA levels with gene specific primers using quantitative RT-PCR. The 18s rRNA tanscript levels were used for normalization. Error bars denote SD (n = 3); (C) A schematic representation of the proteasome recovery assays is shown; (D) A549, HCT116, and MDA-MB-231 cells were treated with 20 nM CFZ for 1 h (pulse treatment). The drugs were, then, washed out and the cells were allowed to recover in the absence or presence of I-BET762(10 µM) and JQ1 (1 µM) for 0, 4, 8, 12, and 24 h. Proteasome activity was measured at indicated time points and normalized to DMSO treated control cells. Error bars denote SD (n = 3); (E) A549, HCT116, and MDA-MB-231 cells were transiently transfected with a firefly luciferase construct driven by eight repeats of the antioxidant response element (8xARE-Luc) along with a renilla luciferase construct. Forty-eight hours after transfection, cells were treated overnight with CFZ (200 nM) alone or in combination with JQ1 (1 µM) or I-BET762 (10 µM) as indicated. Dual luciferase assays were, then, performed to measure the firefly and renilla luciferase activity values. Normalized luciferase activity is shown. Error bars denote SD (n = 3); (F) MDA-MB-231-shNrf1 cells were treated with different doses of CFZ (0.5, 2, 8, and 32 nM), along with one of the BET inhibitors (I-BET762, JQ1) in different doses (0.1, 0.4, 1.6, and 6.4 μM) for 72 h. The combination index (CI) and fraction affected (Fa) values were determined using CompuSyn software from cell viability data, and are shown in the graph. The results are shown as mean ± SD, n = 3. CI < 1.0 indicates synergism, CI = 1.0 indicates additive effect, and CI > 1.0 indicates antagonism. *, p < 0.05, **, p < 0.005, ***, and p < 0.0005 as compared with controls; #, p < 0.05, ##, p < 0.005, and ###, p < 0.0005 as compared with the CFZ-treated group.

