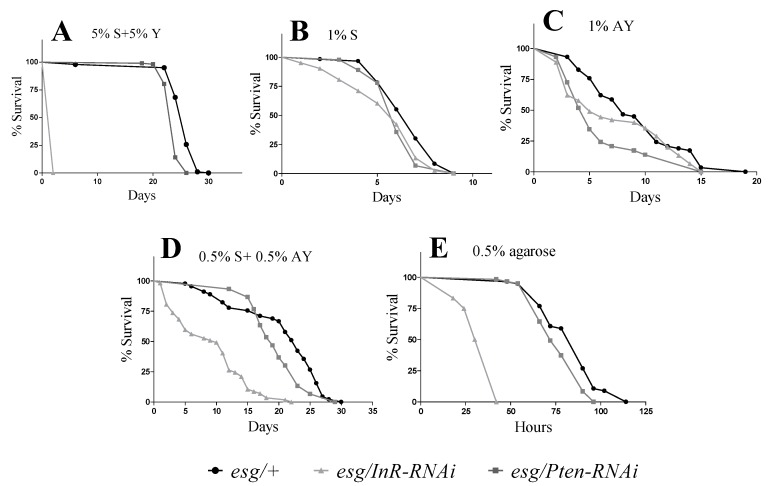
Figure 1.
Survival curves for the experimental flies with insulin–IGF-1 signaling (IIS) manipulated in stem and progenitor cells under various dietary conditions: A—standard medium (5%S + 5%Y); B—low carbohydrate diet (1%S); C—low protein diet (1%AY); D—balanced malnutrition diet (0.5%S + 0.5%AY); E—complete starvation (0.5% agarose). The readout of the experimental days starts initially after six days of expression induction at 29 °C. Each curve represents the percentage of individuals alive. The genotypes were compared using log-rank test (see Table S1 for complete statistics).

