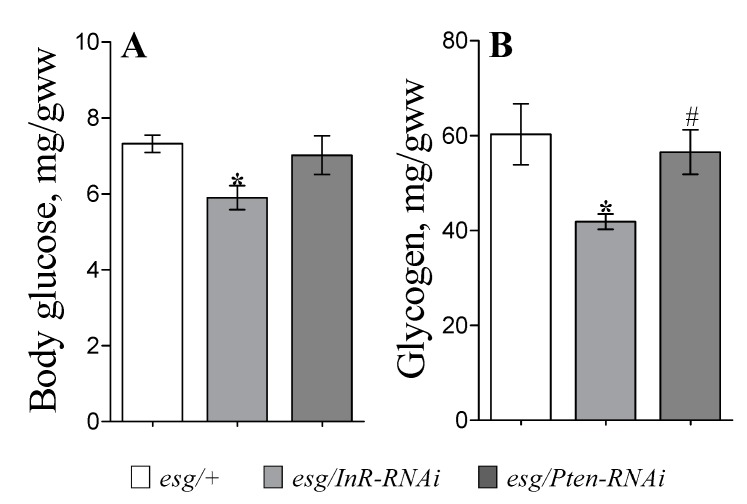
Figure 3.
Body glucose contents (A) and glycogen amounts (B) in flies with IIS modulated in stem and progenitor cells. Flies were used after six days of expression induction by fly transfer to 29 °C. Results represent the mean ± SEM of 4 or 5 replicates per genotype. Group comparisons were performed using ANOVA followed by Newman–Keuls post hoc test. Asterisks indicate significant difference from the control flies (esg/+) (p < 0.05); hash sign shows significant difference from flies with inhibited IIS (esg/InR-RNAi).

