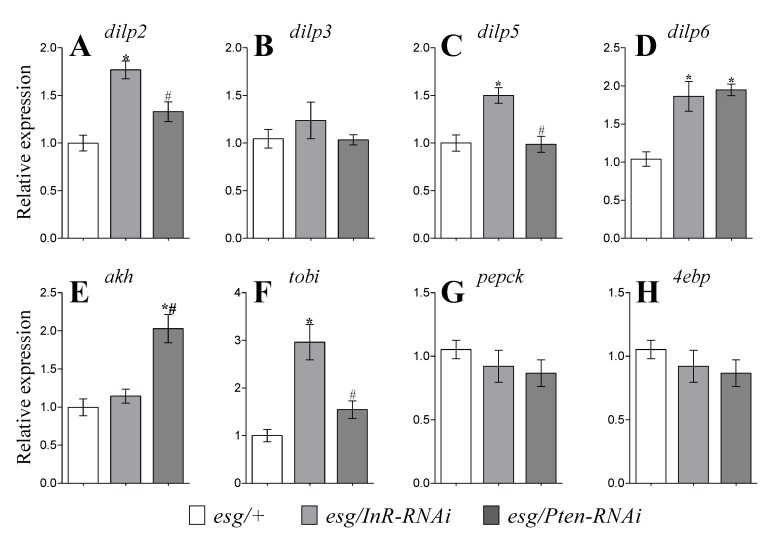
Figure 4.
The mRNA levels for dilp2 (A), dilp3 (B), and dilp5 (C) in fly heads and dilp6 (D) from whole fly bodies and transcript levels of genes related to glucagon-like signaling and metabolism: akh (E), tobi (F), pepck (G), and 4ebp (H) from whole fly bodies. Parameters were measured in flies kept at 29 °C for six days for RNAi expression induction. Data are mean values for 4 independent measurements (± SEM). Group comparisons were performed using ANOVA followed by Newman–Keuls post hoc test. Asterisks indicate significant difference from the control flies (esg/+) (p < 0.05); hash signs show significant difference from flies with inhibited IIS (esg/InR-RNAi).

