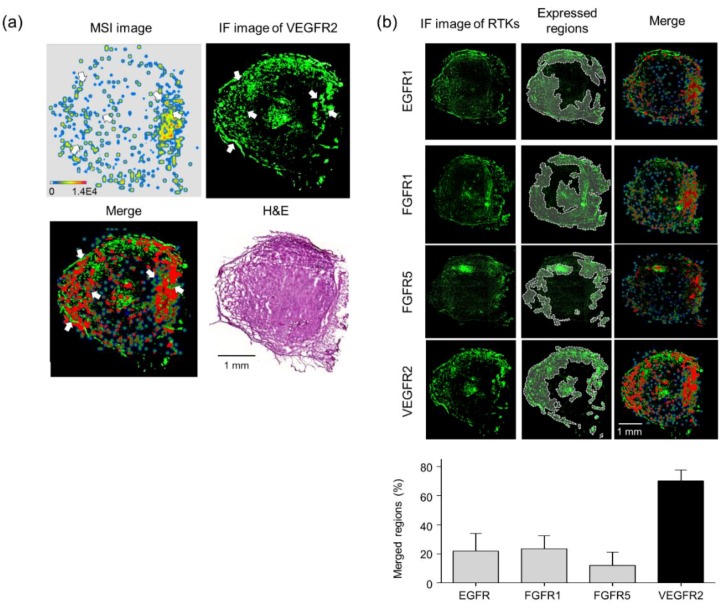
Figure 6.
Validation of target interaction by colocalization of voacangine with VEGFR2 and other RTKs. (a) Comparison of voacangine MSI (precursor ion) and immunofluorescence staining of the target candidate, VEGFR2, in voacangine-treated tumor tissue. The overlaid image with transparent MSI signal on the immunofluorescence staining image for VEGFR2 is visualized in the merged region (red). Scale bar, 1 mm. (b) Comparisons and quantitation of merged regions for voacangine distribution and RTK receptors (EGFR1, FGFR1, FGFR5, and VEGFR2) in tumor tissues. Regions of expression for each RTK are indicated with white dashed lines on the immunofluorescence images. The merged regions are visualized in red. The results shown are representative of three independent experiments. Each value represents the mean ± S.D. from three independent experiments. Scale bar, 1 mm.

