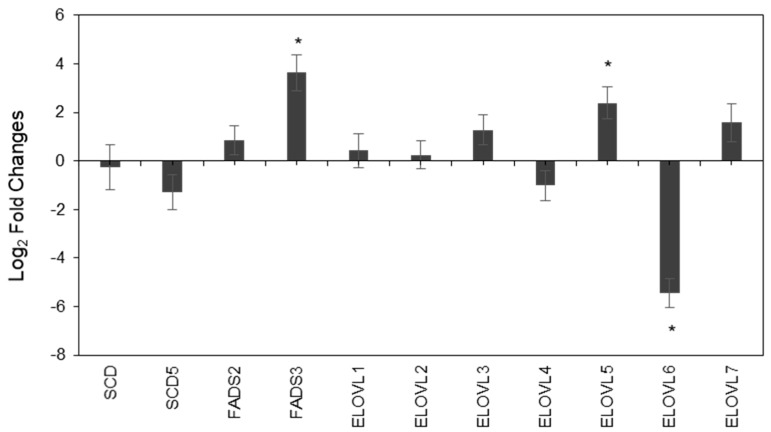
Figure 2.
Evaluation of desaturase and elongase expression in PC3 cells by qRT-PCR (quantitative real Time polymerase chain reaction). X-axis presents 4 desaturase and 7 elongase enzymes. Y-axis represents the log2 (fold-change) of PC3 with respect to LNCaP cells. Fold-change was calculated by the comparative CT method (ΔΔCT) using glyceraldehyde 3-phosphate dehydrogenase (GAPDH) as control for ΔCt and calculating ΔΔCt by subtracting ΔCt for PC3 to ΔCt for LNCaP.

