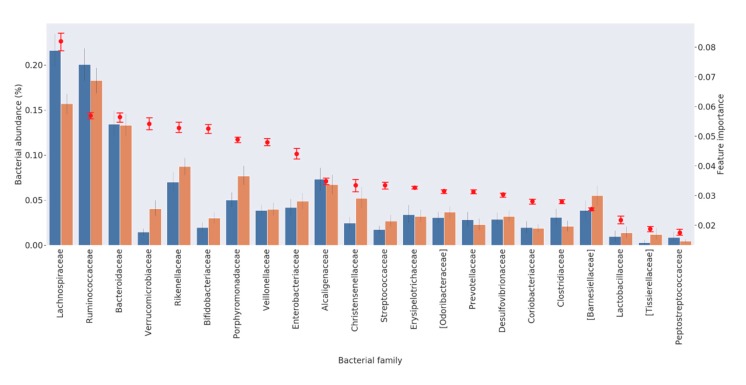
Figure 2.
List of the 22 bacterial families required for discriminating between HC and PD patients. For each family, the average percentage of abundance is represented by a bar, orange for HC and blue for PD patients (left scale). The importance of the family in discriminating the status is represented by a red dot (right scale).

