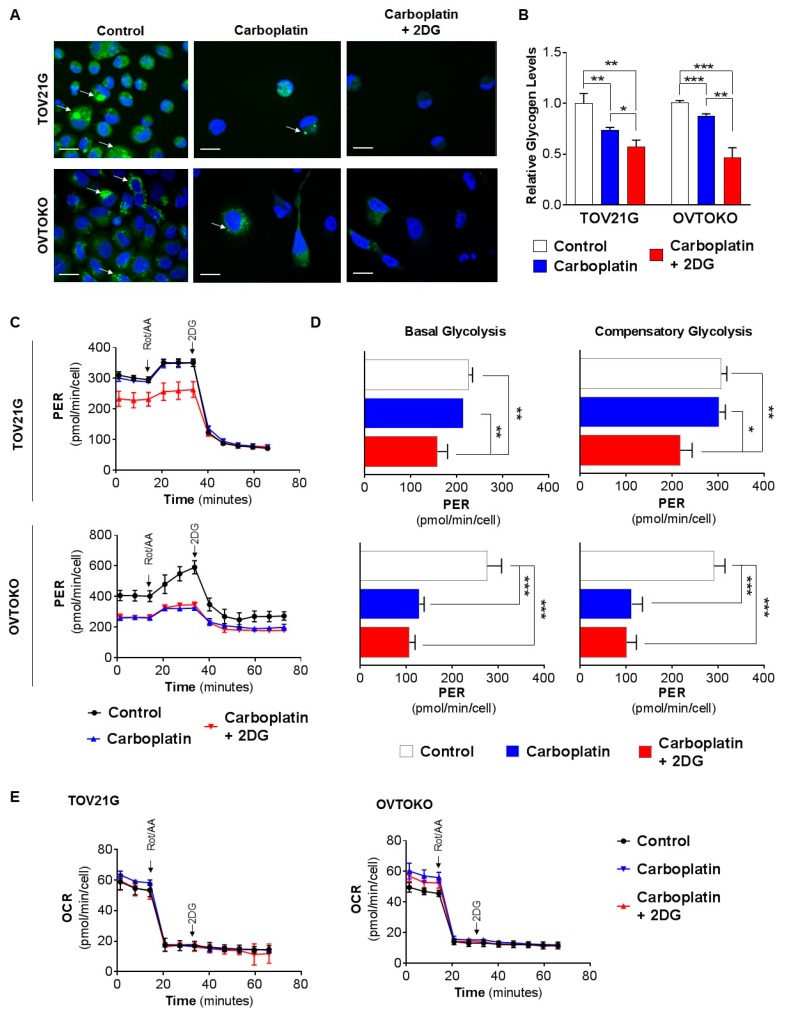
Figure 3.
In combination with carboplatin, 2DG reduces glycogen levels in OCC cells in vitro. (A,B) Cells were treated for 72 h with PBS, carboplatin (GI50 concentration determined in Figure 2A), or carboplatin and 2DG (0.6 mM). (A) Confocal microscope images of cells incubated with green fluorescent 2-NBDG for 3 h. Carboplatin and carboplatin/2DG treatments considerably reduced cell numbers, which was accompanied by reduced levels of 2-NBDG fluorescent signal per cell. Scale bar, 20 µm. (B) Graphs of relative glycogen levels quantified by analysis of lysates from cells collected prior to 2-NBDG treatments. (C) Graph of PER for TOV21G (upper) and OVTOKO (lower) cells treated with PBS, as control, carboplatin (GI50 concentration determined in Figure 2A), or carboplatin, combined with 2DG (0.6 mM) for 24 h. (D) Graph of basal (left) and compensatory (right) PER for TOV21G (upper) and OVTOKO (lower) cells. Data were derived from (C). (E) Graph of OCR for TOV21G (left) and OVTOKO (right) cells treated with PBS, as control, carboplatin (GI50 concentration determined in Figure 2A), or carboplatin combined with 2DG (0.6 mM) for 24 h. In C to E, the inhibitors rotenone and antimycin A were introduced to eliminate oxidative phosphorylation, followed by 2DG to ablate glycolysis. Results are presented as mean +/− SEM from triplicates of three independent assays. *, p ≤ 0.05; **, p ≤ 0.01; ***, p ≤ 0.001.

