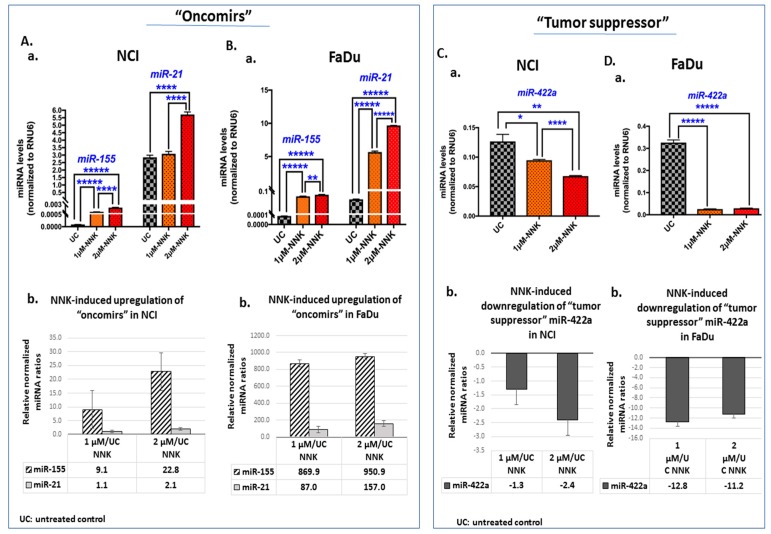
Figure 5.
Either low or high dose of NNK induces deregulation of “oncomirs”, miR-21 and miR-155, and “tumor suppressor” miR-422a, in (A) NCI and (B) FaDu. (A-a and B-a) Graphs depict the expression levels of “oncomirs”, miR-155 and miR-21, in untreated and NNK-treated NCI and FaDu, respectively. (A-b and B-b) The graphs illustrate the NNK-induced upregulation of “oncomirs”, miR-21 and miR-155, in NCI and FaDu cells, respectively, as demonstrated by the relative expression ratios in NNK-treated (1 μM or 2 μM) versus untreated controls. (C-a and D-a) The graphs illustrate the NNK-induced downregulation of “tumor suppressor” miR-422a, in NCI and FaDu, respectively, as demonstrated by the relative expression ratios in NNK-treated (1 μM or 2 μM) versus untreated controls. [miRNA levels were normalized to RNU6 reference control. Data were obtained from three independent experiments; p values by t-test; * p < 0.05, ** p < 0.005, **** p < 0.00005, ***** p < 0.000005; GraphPad Prism 7.0, means (SD)].

