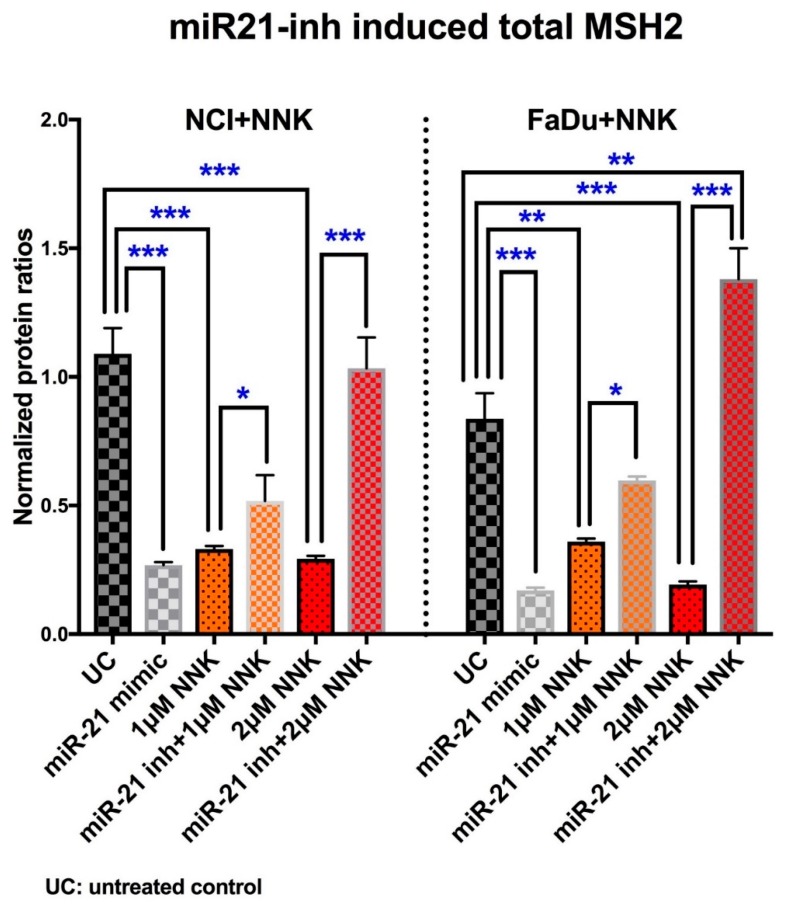
Figure 6.
Inhibition of miR-21 prevents NNK-induced MSH2 reduction. Graphs created by GraphPad Prism 7.0 depict total MSH2 protein level in NCI and FaDu exposed to 1 μM or 2 μM of NNK, with and without miR-21 inhibitor. Controls: cells treated with mimic miR-21 and untreated controls. (Data obtained from three independent experiments [* p < 0.05; ** p < 0.005; *** p < 0.0005, by t-test; multiple comparisons by Holm-Sidak; GraphPad Prism 7.0; means (SD)].

