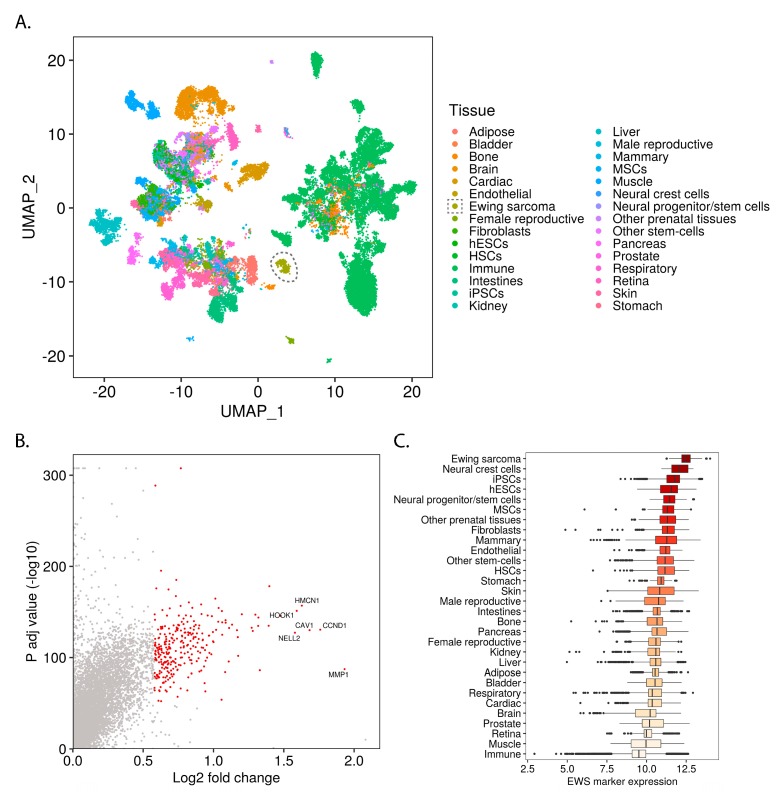
Figure 1.
Mass-scale mining of bulk transcriptomes reveals the relationship of Ewing sarcoma to normal tissue types: (A) UMAP embedding of bulk transcriptomic profiles from normal tissues and Ewing sarcoma samples (Ewing samples circled); (B) One-way volcano plot showing the top Ewing sarcoma marker genes from Wilcoxon rank-sum testing with Bonferroni correction; (C) Box-plot comparing the Ewing sarcoma marker gene expression levels for different samples (median of variance stabilizing transform (VST) transformed and geometric mean normalized read counts for all Ewing sarcoma marker genes within each sample), grouped by tissue and ordered by median expression.

